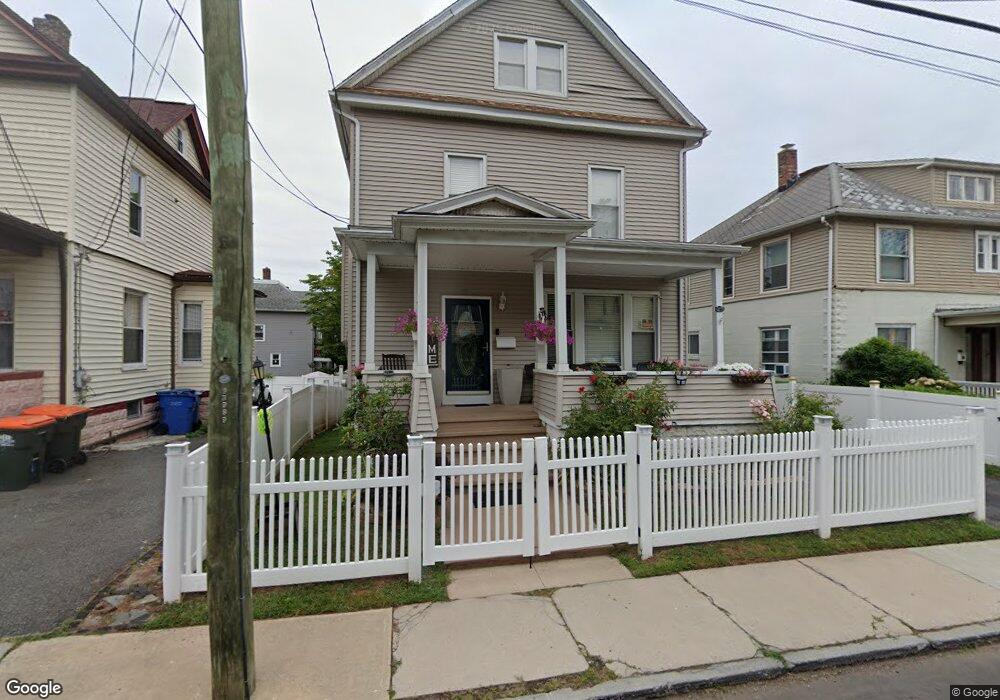
27 Union St Meriden, CT 06451
Estimated Value: $197,000 - $349,000
5
Beds
2
Baths
2,167
Sq Ft
$136/Sq Ft
Est. Value
About This Home
This home is located at 27 Union St, Meriden, CT 06451 and is currently estimated at $295,700, approximately $136 per square foot. 27 Union St is a home located in New Haven County with nearby schools including John Barry School, Lincoln Middle School, and Orville H. Platt High School.
Ownership History
Date
Name
Owned For
Owner Type
Purchase Details
Closed on
Feb 5, 2003
Sold by
Torres Romanita
Bought by
Carrasquillo Mavibel
Current Estimated Value
Home Financials for this Owner
Home Financials are based on the most recent Mortgage that was taken out on this home.
Original Mortgage
$77,000
Interest Rate
5.99%
Purchase Details
Closed on
May 31, 2000
Sold by
Emc Mtg Corp
Bought by
Torres Romanita
Home Financials for this Owner
Home Financials are based on the most recent Mortgage that was taken out on this home.
Original Mortgage
$46,350
Interest Rate
8.14%
Purchase Details
Closed on
Nov 18, 1994
Sold by
Lambda Legal Defense
Bought by
Harkless Curtis and Harkless Santa E
Create a Home Valuation Report for This Property
The Home Valuation Report is an in-depth analysis detailing your home's value as well as a comparison with similar homes in the area
Home Values in the Area
Average Home Value in this Area
Purchase History
| Date | Buyer | Sale Price | Title Company |
|---|---|---|---|
| Carrasquillo Mavibel | $86,000 | -- | |
| Torres Romanita | $45,000 | -- | |
| Harkless Curtis | $53,600 | -- |
Source: Public Records
Mortgage History
| Date | Status | Borrower | Loan Amount |
|---|---|---|---|
| Open | Harkless Curtis | $90,000 | |
| Closed | Harkless Curtis | $77,000 | |
| Previous Owner | Harkless Curtis | $46,350 |
Source: Public Records
Tax History
| Year | Tax Paid | Tax Assessment Tax Assessment Total Assessment is a certain percentage of the fair market value that is determined by local assessors to be the total taxable value of land and additions on the property. | Land | Improvement |
|---|---|---|---|---|
| 2025 | $4,705 | $124,110 | $19,600 | $104,510 |
| 2024 | $4,779 | $124,110 | $19,600 | $104,510 |
| 2023 | $4,607 | $124,110 | $19,600 | $104,510 |
| 2022 | $4,346 | $124,110 | $19,600 | $104,510 |
| 2021 | $3,492 | $80,220 | $16,520 | $63,700 |
| 2020 | $3,482 | $80,220 | $16,520 | $63,700 |
| 2019 | $3,453 | $80,220 | $16,520 | $63,700 |
| 2018 | $3,466 | $80,220 | $16,520 | $63,700 |
| 2017 | $3,374 | $80,220 | $16,520 | $63,700 |
| 2016 | $3,900 | $100,730 | $18,480 | $82,250 |
| 2015 | $3,900 | $100,590 | $18,340 | $82,250 |
| 2014 | $3,805 | $100,590 | $18,340 | $82,250 |
Source: Public Records
Map
Nearby Homes
- 243 Grove St
- 49 Prospect St
- 201 Colony St
- 33 W Main St Unit 11
- 33 W Main St Unit 16
- 33 W Main St Unit 17
- 33 W Main St Unit 1
- 171 Foster St
- 14 North St
- 55 Lewis Ave
- 25 Catlin St
- 200 W Main St
- 185 Springdale Ave
- 250 Pratt St
- 230 W Main St
- 61 Randolph Ave
- 74 Randolph Ave
- 236 W Main St
- 80 Willow St
- 23 N 1st St
Your Personal Tour Guide
Ask me questions while you tour the home.