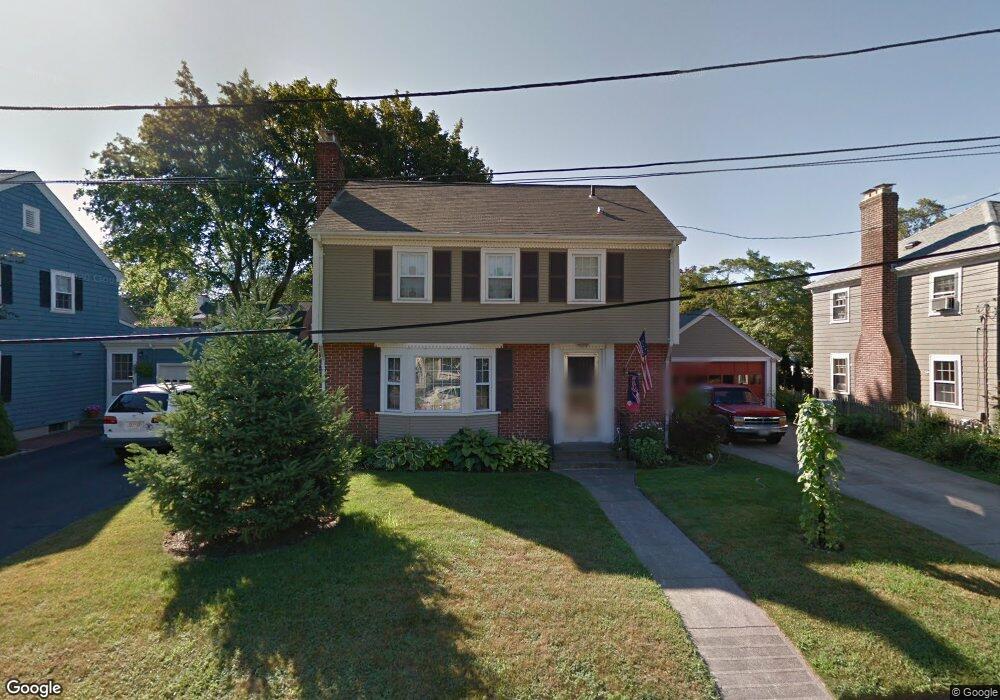
27 Upyonda Way Rumford, RI 02916
Rumford NeighborhoodEstimated Value: $601,261 - $659,000
3
Beds
2
Baths
1,793
Sq Ft
$351/Sq Ft
Est. Value
About This Home
This home is located at 27 Upyonda Way, Rumford, RI 02916 and is currently estimated at $628,565, approximately $350 per square foot. 27 Upyonda Way is a home located in Providence County with nearby schools including East Providence High School, St Margaret School, and The Wolf School.
Ownership History
Date
Name
Owned For
Owner Type
Purchase Details
Closed on
Mar 29, 2023
Sold by
Johnson Kristine K
Bought by
Johnson Kristine K and Kreutel William E
Current Estimated Value
Purchase Details
Closed on
Oct 26, 2021
Sold by
Johnson Robert C and Johnson Kuni K
Bought by
Johnson Kristine K and Johnson Robert C
Create a Home Valuation Report for This Property
The Home Valuation Report is an in-depth analysis detailing your home's value as well as a comparison with similar homes in the area
Home Values in the Area
Average Home Value in this Area
Purchase History
| Date | Buyer | Sale Price | Title Company |
|---|---|---|---|
| Johnson Kristine K | -- | None Available | |
| Johnson Kristine K | -- | None Available | |
| Johnson Kristine K | -- | None Available | |
| Johnson Kristine K | -- | None Available |
Source: Public Records
Tax History Compared to Growth
Tax History
| Year | Tax Paid | Tax Assessment Tax Assessment Total Assessment is a certain percentage of the fair market value that is determined by local assessors to be the total taxable value of land and additions on the property. | Land | Improvement |
|---|---|---|---|---|
| 2024 | $7,381 | $481,500 | $174,600 | $306,900 |
| 2023 | $7,107 | $481,500 | $174,600 | $306,900 |
| 2022 | $6,951 | $318,000 | $98,800 | $219,200 |
| 2021 | $6,837 | $318,000 | $94,800 | $223,200 |
| 2020 | $6,548 | $318,000 | $94,800 | $223,200 |
| 2019 | $6,366 | $318,000 | $94,800 | $223,200 |
| 2018 | $6,356 | $277,800 | $88,800 | $189,000 |
| 2017 | $6,214 | $277,800 | $88,800 | $189,000 |
| 2016 | $6,184 | $277,800 | $88,800 | $189,000 |
| 2015 | $6,187 | $269,600 | $82,100 | $187,500 |
| 2014 | $6,187 | $269,600 | $82,100 | $187,500 |
Source: Public Records
Map
Nearby Homes
- 40 Upyonda Way
- 24 Morra Way
- 12 Arthur St
- 62 Byron Ave
- 71 Priscilla Ave
- 27 Gertrude Ave
- 14 Evelyn Way
- 0 Pleasant St
- 0 Newman Ave Rear
- 0 Taunton Ave
- 16 Elm Ave
- 10 Linden Ave
- 224 Arcade Ave
- 48 Hobson Ave
- 0 Milton St Unit 72633661
- 41 What Cheer Ave
- 296 Fall River Ave
- 136 Hoyt Ave
- 442 Taunton Ave
- 125 Roger Williams Ave