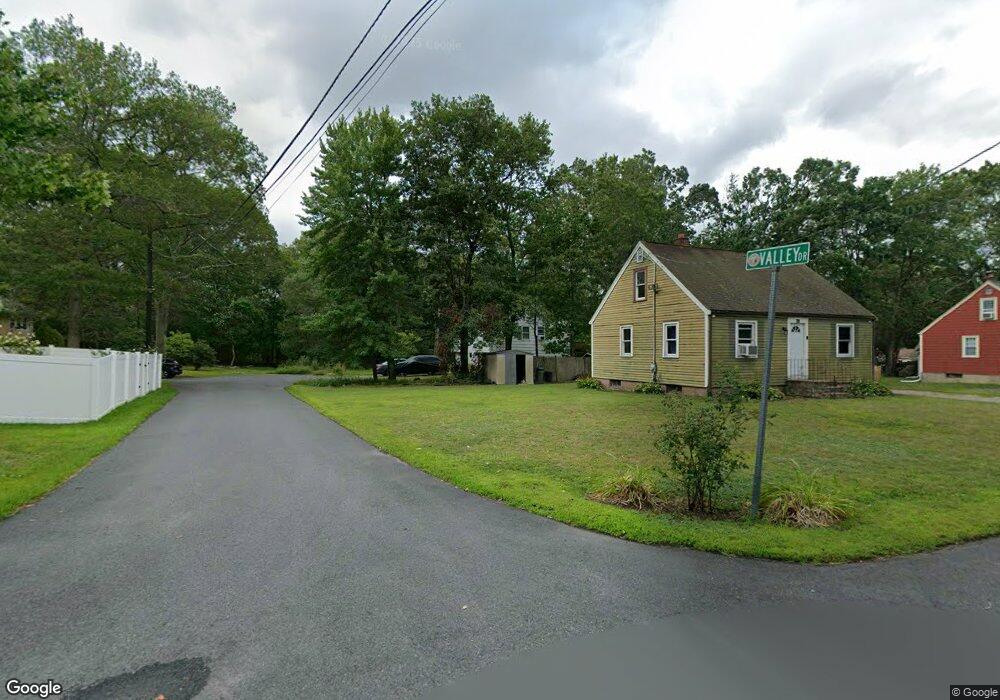
27 Valley Dr North Attleboro, MA 02760
North Attleboro NeighborhoodEstimated Value: $475,000 - $490,056
3
Beds
1
Bath
1,360
Sq Ft
$353/Sq Ft
Est. Value
About This Home
This home is located at 27 Valley Dr, North Attleboro, MA 02760 and is currently estimated at $479,514, approximately $352 per square foot. 27 Valley Dr is a home located in Bristol County with nearby schools including North Attleboro High School.
Ownership History
Date
Name
Owned For
Owner Type
Purchase Details
Closed on
Nov 6, 2008
Sold by
Isom Alina K and Isom Michael A
Bought by
Isom Alina K
Current Estimated Value
Purchase Details
Closed on
Jun 29, 2001
Sold by
Sias David D and Sias Lynne F
Bought by
Isom Michael A and Isom Alina K
Home Financials for this Owner
Home Financials are based on the most recent Mortgage that was taken out on this home.
Original Mortgage
$203,000
Interest Rate
7.14%
Mortgage Type
Purchase Money Mortgage
Create a Home Valuation Report for This Property
The Home Valuation Report is an in-depth analysis detailing your home's value as well as a comparison with similar homes in the area
Home Values in the Area
Average Home Value in this Area
Purchase History
| Date | Buyer | Sale Price | Title Company |
|---|---|---|---|
| Isom Alina K | -- | -- | |
| Isom Michael A | $203,000 | -- |
Source: Public Records
Mortgage History
| Date | Status | Borrower | Loan Amount |
|---|---|---|---|
| Previous Owner | Isom Michael A | $210,000 | |
| Previous Owner | Isom Michael A | $203,000 | |
| Previous Owner | Isom Michael A | $10,000 |
Source: Public Records
Tax History Compared to Growth
Tax History
| Year | Tax Paid | Tax Assessment Tax Assessment Total Assessment is a certain percentage of the fair market value that is determined by local assessors to be the total taxable value of land and additions on the property. | Land | Improvement |
|---|---|---|---|---|
| 2025 | $4,553 | $386,200 | $143,100 | $243,100 |
| 2024 | $4,359 | $377,700 | $143,100 | $234,600 |
| 2023 | $4,649 | $363,500 | $143,100 | $220,400 |
| 2022 | $4,516 | $324,200 | $143,100 | $181,100 |
| 2021 | $4,521 | $309,100 | $143,100 | $166,000 |
| 2020 | $4,354 | $299,800 | $143,100 | $156,700 |
| 2019 | $4,085 | $286,900 | $130,200 | $156,700 |
| 2018 | $4,328 | $273,600 | $130,200 | $143,400 |
| 2017 | $3,494 | $264,300 | $130,200 | $134,100 |
| 2016 | $3,458 | $261,600 | $144,600 | $117,000 |
| 2015 | $3,243 | $246,800 | $144,600 | $102,200 |
| 2014 | $3,053 | $230,600 | $126,900 | $103,700 |
Source: Public Records
Map
Nearby Homes
- 40 Roosevelt Ave
- 16 Johnson St
- 41 Roosevelt Ave
- 80 Broadway Unit 9
- 137 Sumner St
- Lot 6 Sperry Ln
- 23-R Eddy Street (Eddy St Rear)
- 93 Bank St
- 16 Richards Ave Unit 106
- 130 E Washington St Unit 57
- 130 E Washington St Unit 71
- 17 Holbrook Ave
- 19 Church St Unit C9
- 68 N Washington St Unit 210
- 300 E Washington St Unit 54R
- 300 E Washington St Unit 20N
- 36 Jefferson St
- 121 E Washington St Unit 8
- 121 E Washington St Unit 12
- 121 E Washington St Unit 13
- 124 Westside Ave
- 132 Westside Ave
- 28 Ranch St
- 24 Valley Dr
- 34 Ranch St
- 142 Westside Ave
- 16 Ranch St
- 123 Crescent Ave
- 125 Westside Ave
- 115 Crescent Ave
- 133 Westside Ave
- 131 Crescent Ave
- 167 Crescent Ave
- 27 Ranch St
- 159 Crescent Ave
- 117 Westside Ave
- 173 Crescent Ave
- 33 Ranch St
- 19 Ranch St
- 105 Crescent Ave