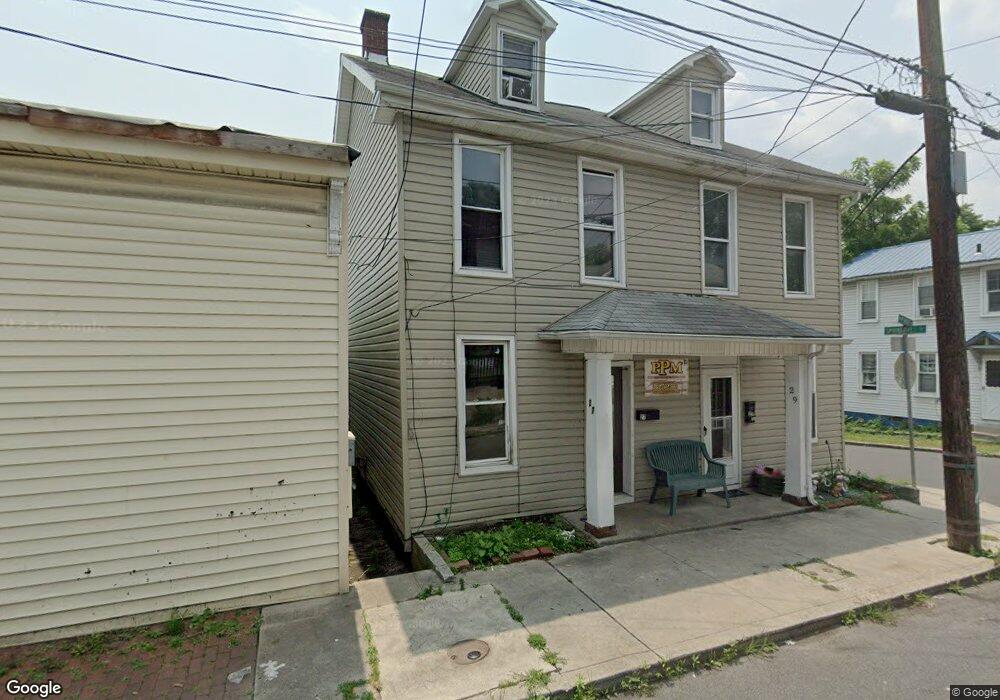
27 W 1st St Cumberland, MD 21502
Estimated Value: $49,000 - $99,000
6
Beds
2
Baths
2,056
Sq Ft
$36/Sq Ft
Est. Value
About This Home
This home is located at 27 W 1st St, Cumberland, MD 21502 and is currently estimated at $73,405, approximately $35 per square foot. 27 W 1st St is a home located in Allegany County with nearby schools including John Humbird Elementary School, Washington Middle School, and Fort Hill High School.
Ownership History
Date
Name
Owned For
Owner Type
Purchase Details
Closed on
Jun 18, 2021
Sold by
Stup Gregory J and Stup Denise C
Bought by
Mep Group Iii Llc
Current Estimated Value
Purchase Details
Closed on
Apr 27, 2007
Sold by
Turner William and Turner Ellen
Bought by
Stup Gregor
Purchase Details
Closed on
Apr 16, 2007
Sold by
Turner William and Turner Ellen
Bought by
Stup Gregor
Purchase Details
Closed on
May 3, 2005
Sold by
Hott Richard K and Hott Barbara J
Bought by
Turner Willia
Purchase Details
Closed on
Nov 1, 1993
Sold by
Vassallo Paula J
Bought by
Hott Richard K-Barbara J
Create a Home Valuation Report for This Property
The Home Valuation Report is an in-depth analysis detailing your home's value as well as a comparison with similar homes in the area
Home Values in the Area
Average Home Value in this Area
Purchase History
| Date | Buyer | Sale Price | Title Company |
|---|---|---|---|
| Mep Group Iii Llc | $430,000 | None Available | |
| Stup Gregor | $50,000 | -- | |
| Stup Gregor | $50,000 | -- | |
| Turner Willia | $15,500 | -- | |
| Hott Richard K-Barbara J | $17,000 | -- |
Source: Public Records
Tax History Compared to Growth
Tax History
| Year | Tax Paid | Tax Assessment Tax Assessment Total Assessment is a certain percentage of the fair market value that is determined by local assessors to be the total taxable value of land and additions on the property. | Land | Improvement |
|---|---|---|---|---|
| 2025 | $546 | $63,733 | $0 | $0 |
| 2024 | $546 | $58,267 | $0 | $0 |
| 2023 | $491 | $52,800 | $6,000 | $46,800 |
| 2022 | $480 | $51,667 | $0 | $0 |
| 2021 | $473 | $50,533 | $0 | $0 |
| 2020 | $459 | $49,400 | $6,000 | $43,400 |
| 2019 | $462 | $49,400 | $6,000 | $43,400 |
| 2018 | $465 | $49,400 | $6,000 | $43,400 |
| 2017 | $455 | $49,400 | $0 | $0 |
| 2016 | $460 | $47,967 | $0 | $0 |
| 2015 | $436 | $46,533 | $0 | $0 |
| 2014 | $436 | $45,100 | $0 | $0 |
Source: Public Records
Map
Nearby Homes