Estimated Value: $138,000 - $197,000
Studio
1
Bath
1,360
Sq Ft
$122/Sq Ft
Est. Value
About This Home
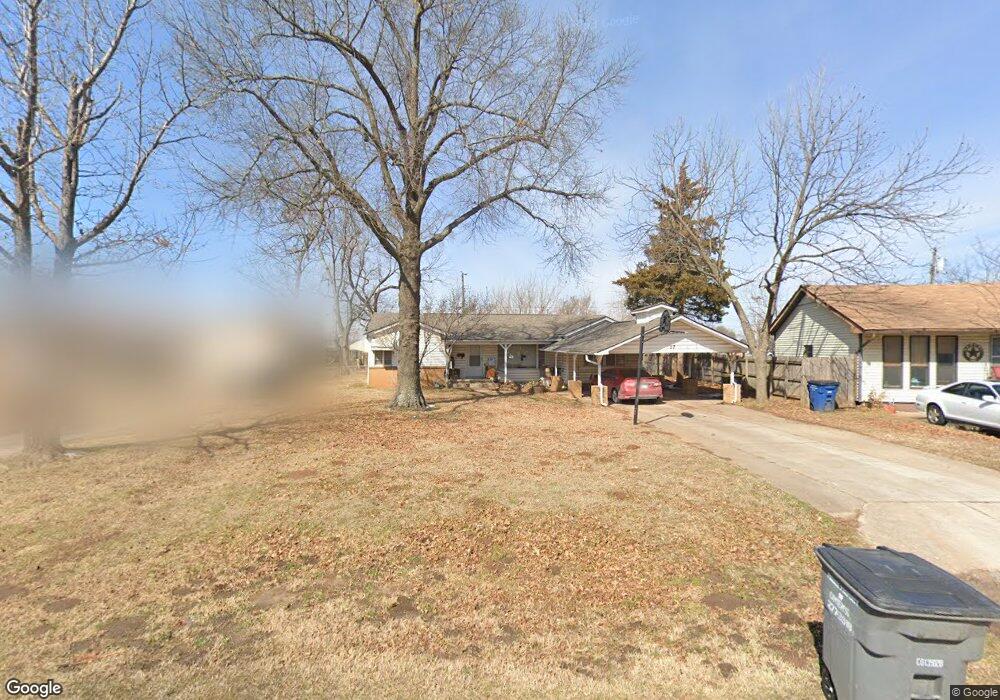
This home is located at 27 W 5th St, Bixby, OK 74008 and is currently estimated at $165,585, approximately $121 per square foot. 27 W 5th St is a home located in Tulsa County with nearby schools including Central Elementary School, Bixby Central Intermediate School, and Bixby Middle School.
Ownership History
Date
Name
Owned For
Owner Type
Purchase Details
Closed on
Sep 29, 2014
Sold by
Martin John Hollis
Bought by
Martin Boller Leo and Boller April Lynne
Current Estimated Value
Home Financials for this Owner
Home Financials are based on the most recent Mortgage that was taken out on this home.
Original Mortgage
$64,916
Outstanding Balance
$20,576
Interest Rate
4.13%
Mortgage Type
FHA
Estimated Equity
$145,009
Purchase Details
Closed on
Dec 29, 2006
Sold by
Shanks Leslie Q
Bought by
Martin John Hollis
Home Financials for this Owner
Home Financials are based on the most recent Mortgage that was taken out on this home.
Original Mortgage
$65,974
Interest Rate
6.2%
Mortgage Type
Purchase Money Mortgage
Purchase Details
Closed on
Aug 27, 2002
Sold by
Shanks Leslie Q
Bought by
Shanks Leslie Q and The Leslie Q Shanks Revocable Trust
Purchase Details
Closed on
Dec 1, 1992
Create a Home Valuation Report for This Property
The Home Valuation Report is an in-depth analysis detailing your home's value as well as a comparison with similar homes in the area
Home Values in the Area
Average Home Value in this Area
Purchase History
| Date | Buyer | Sale Price | Title Company |
|---|---|---|---|
| Martin Boller Leo | $75,000 | Nations Title Of Okc | |
| Martin John Hollis | $65,000 | Firstitle & Abstract Service | |
| Shanks Leslie Q | -- | -- | |
| -- | $48,500 | -- |
Source: Public Records
Mortgage History
| Date | Status | Borrower | Loan Amount |
|---|---|---|---|
| Open | Martin Boller Leo | $64,916 | |
| Previous Owner | Martin John Hollis | $65,974 |
Source: Public Records
Tax History
| Year | Tax Paid | Tax Assessment Tax Assessment Total Assessment is a certain percentage of the fair market value that is determined by local assessors to be the total taxable value of land and additions on the property. | Land | Improvement |
|---|---|---|---|---|
| 2025 | $1,603 | $11,690 | $1,408 | $10,282 |
| 2024 | $1,483 | $11,133 | $1,672 | $9,461 |
| 2023 | $1,483 | $10,603 | $1,531 | $9,072 |
| 2022 | $1,419 | $10,098 | $1,807 | $8,291 |
| 2021 | $1,263 | $9,617 | $1,721 | $7,896 |
| 2020 | $1,210 | $9,159 | $1,924 | $7,235 |
| 2019 | $1,215 | $9,159 | $1,924 | $7,235 |
| 2018 | $1,149 | $8,743 | $1,837 | $6,906 |
| 2017 | $1,131 | $8,662 | $1,820 | $6,842 |
| 2016 | $1,064 | $8,250 | $1,837 | $6,413 |
| 2015 | $1,018 | $8,250 | $1,837 | $6,413 |
| 2014 | $881 | $7,150 | $1,837 | $5,313 |
Source: Public Records
Map
Nearby Homes
- 13 W 4th St
- 016847 S Memorial Dr
- 7220 E 154th Place S
- 3501 E 153rd St S
- 3421 E 153rd St S
- 408 N Armstrong St
- 7525 E 156th Place S
- 7542 E 156th Place S
- 7519 E 156th Place S
- 7536 E 156th Place S
- 7513 E 156th Place S
- 7530 E 156th Place S
- 7507 E 156th Place S
- 7518 E 156th Place S
- 10001 E 135th St S
- 9903 E 135th St S
- 9921 E 135th St S
- 13518 S 101st East Ave
- 10007 E 135th St S
- 7500 E 156th Place S