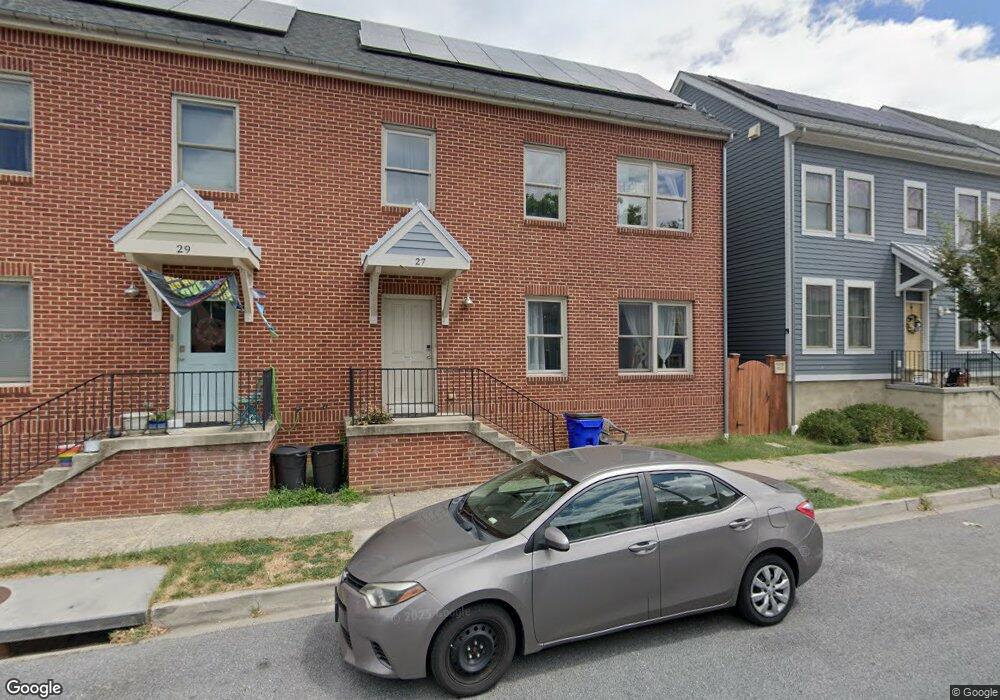
27 W 6th St Frederick, MD 21701
Downtown Frederick NeighborhoodEstimated Value: $403,000 - $541,000
Studio
2
Baths
1,508
Sq Ft
$316/Sq Ft
Est. Value
About This Home
This home is located at 27 W 6th St, Frederick, MD 21701 and is currently estimated at $476,750, approximately $316 per square foot. 27 W 6th St is a home located in Frederick County with nearby schools including North Frederick Elementary School, Gov. Thomas Johnson Middle School, and Gov. Thomas Johnson High School.
Ownership History
Date
Name
Owned For
Owner Type
Purchase Details
Closed on
Dec 12, 2013
Sold by
Housing Authority Of The City Of Frederi
Bought by
Nexus Energyhomes Inc
Current Estimated Value
Home Financials for this Owner
Home Financials are based on the most recent Mortgage that was taken out on this home.
Original Mortgage
$210,500
Outstanding Balance
$158,199
Interest Rate
4.35%
Mortgage Type
Unknown
Estimated Equity
$318,551
Create a Home Valuation Report for This Property
The Home Valuation Report is an in-depth analysis detailing your home's value as well as a comparison with similar homes in the area
Home Values in the Area
Average Home Value in this Area
Purchase History
| Date | Buyer | Sale Price | Title Company |
|---|---|---|---|
| Nexus Energyhomes Inc | $308,593 | None Available |
Source: Public Records
Mortgage History
| Date | Status | Borrower | Loan Amount |
|---|---|---|---|
| Open | Nexus Energyhomes Inc | $210,500 | |
| Closed | Nexus Energyhomes Inc | $93,297 | |
| Closed | Nexus Energyhomes Inc | $5,000 |
Source: Public Records
Tax History
| Year | Tax Paid | Tax Assessment Tax Assessment Total Assessment is a certain percentage of the fair market value that is determined by local assessors to be the total taxable value of land and additions on the property. | Land | Improvement |
|---|---|---|---|---|
| 2025 | $6,141 | $347,200 | $80,100 | $267,100 |
| 2024 | $6,141 | $330,233 | $0 | $0 |
| 2023 | $5,667 | $313,267 | $0 | $0 |
| 2022 | $5,346 | $296,300 | $80,100 | $216,200 |
| 2021 | $5,351 | $296,300 | $80,100 | $216,200 |
| 2020 | $5,329 | $296,300 | $80,100 | $216,200 |
| 2019 | $5,465 | $304,100 | $70,000 | $234,100 |
| 2018 | $5,436 | $299,800 | $0 | $0 |
| 2017 | $5,306 | $304,100 | $0 | $0 |
| 2016 | -- | $291,200 | $0 | $0 |
| 2015 | -- | $217,467 | $0 | $0 |
| 2014 | -- | $0 | $0 | $0 |
Source: Public Records
Map
Nearby Homes
Your Personal Tour Guide
Ask me questions while you tour the home.