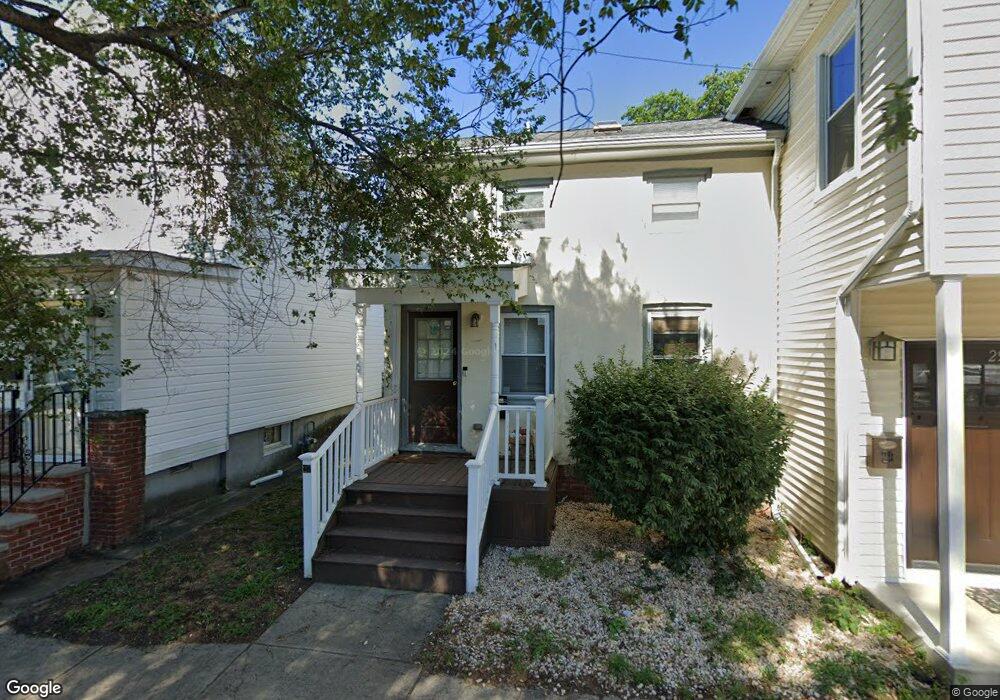
27 Waverly St Keyport, NJ 07735
Estimated Value: $695,000 - $867,000
5
Beds
3
Baths
3,252
Sq Ft
$236/Sq Ft
Est. Value
About This Home
This home is located at 27 Waverly St, Keyport, NJ 07735 and is currently estimated at $767,999, approximately $236 per square foot. 27 Waverly St is a home located in Monmouth County with nearby schools including Keyport Central School, Keyport High School, and Icob Academy.
Ownership History
Date
Name
Owned For
Owner Type
Purchase Details
Closed on
Mar 31, 2003
Sold by
Kacmarsky Ronald
Bought by
Munck Robert
Current Estimated Value
Home Financials for this Owner
Home Financials are based on the most recent Mortgage that was taken out on this home.
Original Mortgage
$187,200
Outstanding Balance
$81,482
Interest Rate
5.93%
Mortgage Type
Commercial
Estimated Equity
$686,517
Purchase Details
Closed on
Jul 22, 1998
Sold by
Socolove Bert
Bought by
Kacmarsky Ronald
Home Financials for this Owner
Home Financials are based on the most recent Mortgage that was taken out on this home.
Original Mortgage
$128,000
Interest Rate
6.99%
Mortgage Type
Commercial
Purchase Details
Closed on
Aug 3, 1995
Sold by
Squicciarini Lawrence
Bought by
Socolove Bert and Socolove Deborah
Home Financials for this Owner
Home Financials are based on the most recent Mortgage that was taken out on this home.
Original Mortgage
$113,000
Interest Rate
7.48%
Mortgage Type
Commercial
Create a Home Valuation Report for This Property
The Home Valuation Report is an in-depth analysis detailing your home's value as well as a comparison with similar homes in the area
Home Values in the Area
Average Home Value in this Area
Purchase History
| Date | Buyer | Sale Price | Title Company |
|---|---|---|---|
| Munck Robert | $208,000 | -- | |
| Kacmarsky Ronald | $142,000 | -- | |
| Socolove Bert | $142,000 | -- |
Source: Public Records
Mortgage History
| Date | Status | Borrower | Loan Amount |
|---|---|---|---|
| Open | Munck Robert | $187,200 | |
| Previous Owner | Kacmarsky Ronald | $128,000 | |
| Previous Owner | Socolove Bert | $113,000 |
Source: Public Records
Tax History Compared to Growth
Tax History
| Year | Tax Paid | Tax Assessment Tax Assessment Total Assessment is a certain percentage of the fair market value that is determined by local assessors to be the total taxable value of land and additions on the property. | Land | Improvement |
|---|---|---|---|---|
| 2025 | $13,084 | $684,200 | $205,100 | $479,100 |
| 2024 | $10,397 | $632,100 | $176,600 | $455,500 |
| 2023 | $10,397 | $473,000 | $160,600 | $312,400 |
| 2022 | $9,587 | $411,100 | $139,600 | $271,500 |
| 2021 | $9,587 | $379,900 | $129,300 | $250,600 |
| 2020 | $9,231 | $363,000 | $124,600 | $238,400 |
| 2019 | $8,963 | $353,000 | $120,100 | $232,900 |
| 2018 | $8,325 | $320,200 | $102,300 | $217,900 |
| 2017 | $8,212 | $315,000 | $99,800 | $215,200 |
| 2016 | $7,605 | $294,200 | $99,800 | $194,400 |
| 2015 | $7,378 | $284,100 | $92,300 | $191,800 |
| 2014 | $6,615 | $257,200 | $67,300 | $189,900 |
Source: Public Records
Map
Nearby Homes