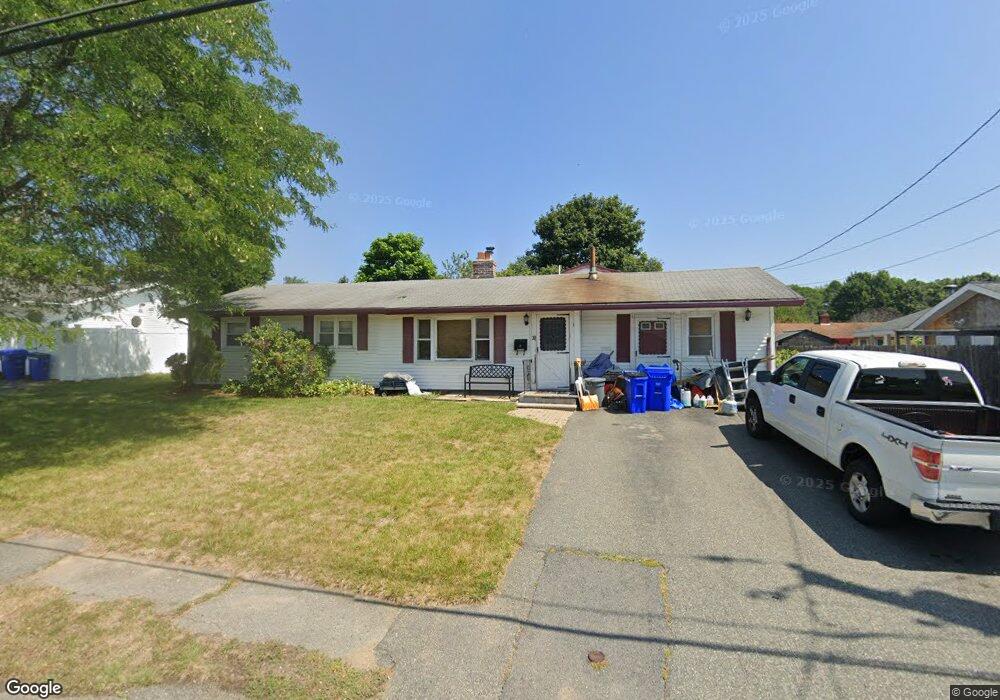
27 William Rd Holbrook, MA 02343
Estimated Value: $515,000 - $618,000
4
Beds
1
Bath
1,712
Sq Ft
$333/Sq Ft
Est. Value
About This Home
This home is located at 27 William Rd, Holbrook, MA 02343 and is currently estimated at $569,729, approximately $332 per square foot. 27 William Rd is a home located in Norfolk County with nearby schools including John F. Kennedy Elementary School, Holbrook Middle High School, and Boston Higashi School.
Ownership History
Date
Name
Owned For
Owner Type
Purchase Details
Closed on
Nov 30, 2011
Sold by
Nieves Daniel
Bought by
Ezekiel Denise M and Ezekiel Paul M
Current Estimated Value
Home Financials for this Owner
Home Financials are based on the most recent Mortgage that was taken out on this home.
Original Mortgage
$238,789
Outstanding Balance
$164,052
Interest Rate
4.1%
Mortgage Type
Purchase Money Mortgage
Estimated Equity
$405,677
Purchase Details
Closed on
Dec 7, 2007
Sold by
Macleod Jennifer M and Macleod Robert N
Bought by
Nieves Daniel
Home Financials for this Owner
Home Financials are based on the most recent Mortgage that was taken out on this home.
Original Mortgage
$179,000
Interest Rate
6.37%
Mortgage Type
Purchase Money Mortgage
Purchase Details
Closed on
Apr 28, 2000
Sold by
Collins Ralph J
Bought by
Macleod Robert and Macleod Jennifer
Create a Home Valuation Report for This Property
The Home Valuation Report is an in-depth analysis detailing your home's value as well as a comparison with similar homes in the area
Home Values in the Area
Average Home Value in this Area
Purchase History
| Date | Buyer | Sale Price | Title Company |
|---|---|---|---|
| Ezekiel Denise M | $245,000 | -- | |
| Ezekiel Denise M | $245,000 | -- | |
| Ezekiel Denise M | $245,000 | -- | |
| Nieves Daniel | $255,000 | -- | |
| Nieves Daniel | $255,000 | -- | |
| Nieves Daniel | $255,000 | -- | |
| Macleod Robert | $148,000 | -- |
Source: Public Records
Mortgage History
| Date | Status | Borrower | Loan Amount |
|---|---|---|---|
| Open | Ezekiel Denise M | $238,789 | |
| Closed | Ezekiel Denise M | $238,789 | |
| Previous Owner | Nieves Daniel | $179,000 |
Source: Public Records
Tax History
| Year | Tax Paid | Tax Assessment Tax Assessment Total Assessment is a certain percentage of the fair market value that is determined by local assessors to be the total taxable value of land and additions on the property. | Land | Improvement |
|---|---|---|---|---|
| 2025 | $60 | $453,100 | $248,200 | $204,900 |
| 2024 | $5,653 | $420,600 | $225,600 | $195,000 |
| 2023 | $5,981 | $388,900 | $205,200 | $183,700 |
| 2022 | $5,519 | $334,700 | $178,400 | $156,300 |
| 2021 | $5,355 | $311,000 | $163,400 | $147,600 |
| 2020 | $5,382 | $293,000 | $152,800 | $140,200 |
| 2019 | $5,422 | $278,600 | $145,500 | $133,100 |
| 2018 | $5,335 | $258,100 | $130,000 | $128,100 |
| 2017 | $5,045 | $241,400 | $118,300 | $123,100 |
| 2016 | $4,592 | $233,800 | $118,300 | $115,500 |
| 2015 | $4,127 | $216,300 | $106,700 | $109,600 |
| 2014 | $3,767 | $200,700 | $97,000 | $103,700 |
Source: Public Records
Map
Nearby Homes
- 45-R Ernest St
- 63 Sycamore St
- 360 Plymouth St
- 22 Medallion Rd
- 123-125 N Franklin St
- 181 S Franklin St Unit 102
- 88 Roseen Rd
- 184 Belcher St
- 152 S Franklin St
- 58 Chandler St
- 35 Marion St
- 36 Summer St
- 27 Winter St
- 95 Rindone St
- 278 N Franklin St
- 5 Clarendon Cir Unit Lot 4
- 8 Dianthus Rd
- 1696 Liberty St
- 129 Albee Dr
- 39 Canavan Dr
Your Personal Tour Guide
Ask me questions while you tour the home.