Estimated Value: $90,000 - $161,000
--
Bed
1
Bath
1,552
Sq Ft
$82/Sq Ft
Est. Value
About This Home
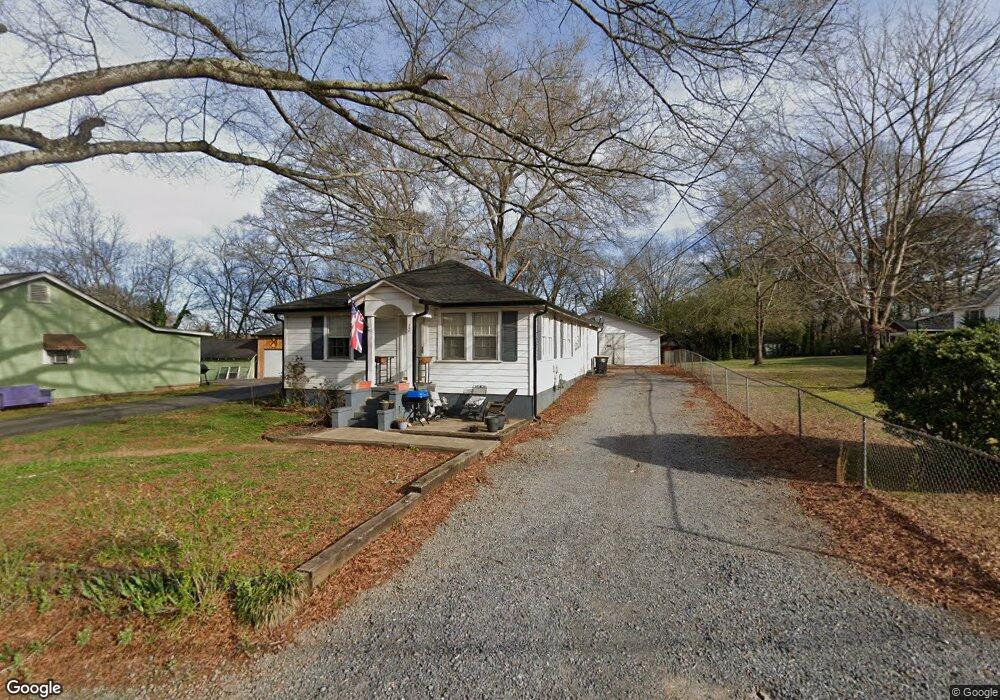
This home is located at 27 Willingham St SW, Rome, GA 30161 and is currently estimated at $126,842, approximately $81 per square foot. 27 Willingham St SW is a home located in Floyd County with nearby schools including Dan McCarty Middle School, Rome High School, and Montessori School of Rome.
Ownership History
Date
Name
Owned For
Owner Type
Purchase Details
Closed on
Jul 12, 2021
Sold by
Ferguson Bobby
Bought by
Taylor John Stephen and Taylor Amber Eve
Current Estimated Value
Home Financials for this Owner
Home Financials are based on the most recent Mortgage that was taken out on this home.
Original Mortgage
$50,000
Outstanding Balance
$45,409
Interest Rate
2.96%
Mortgage Type
New Conventional
Estimated Equity
$81,433
Purchase Details
Closed on
Jun 13, 1997
Bought by
P and R
Purchase Details
Closed on
Mar 16, 1995
Sold by
Thomas Allen
Bought by
Ferguson Bobby and Diane Ferguson
Purchase Details
Closed on
Jan 9, 1995
Sold by
Cantrell Addie Lee
Bought by
Thomas Allen
Purchase Details
Closed on
Oct 2, 1989
Bought by
P and R
Purchase Details
Closed on
Jun 27, 1988
Sold by
Cantrell D L Mrs
Bought by
Cantrell Addie Lee
Purchase Details
Closed on
May 12, 1983
Sold by
Cantrell Mrs D L Cantrell Mrs D L Cantr
Bought by
Cantrell D L Mrs
Purchase Details
Closed on
Jan 1, 1950
Sold by
Cantrell D L Cantrell D L Cantrell D L
Bought by
Cantrell D L
Purchase Details
Closed on
Jan 1, 1901
Bought by
Cantrell D L Cantrell D L Cantrell
Create a Home Valuation Report for This Property
The Home Valuation Report is an in-depth analysis detailing your home's value as well as a comparison with similar homes in the area
Home Values in the Area
Average Home Value in this Area
Purchase History
| Date | Buyer | Sale Price | Title Company |
|---|---|---|---|
| Taylor John Stephen | $62,500 | -- | |
| P | -- | -- | |
| Ferguson Bobby | -- | -- | |
| Thomas Allen | -- | -- | |
| P | -- | -- | |
| Cantrell Addie Lee | -- | -- | |
| Cantrell D L Mrs | -- | -- | |
| Cantrell Mrs D L Cantrell Mrs D L C | -- | -- | |
| Cantrell D L | -- | -- | |
| Cantrell D L Cantrell D L Cantrell | -- | -- |
Source: Public Records
Mortgage History
| Date | Status | Borrower | Loan Amount |
|---|---|---|---|
| Open | Taylor John Stephen | $50,000 |
Source: Public Records
Tax History Compared to Growth
Tax History
| Year | Tax Paid | Tax Assessment Tax Assessment Total Assessment is a certain percentage of the fair market value that is determined by local assessors to be the total taxable value of land and additions on the property. | Land | Improvement |
|---|---|---|---|---|
| 2024 | $1,339 | $34,283 | $4,977 | $29,306 |
| 2023 | $1,214 | $31,418 | $4,525 | $26,893 |
| 2022 | $912 | $25,867 | $3,620 | $22,247 |
| 2021 | $872 | $23,513 | $3,620 | $19,893 |
| 2020 | $673 | $21,584 | $2,828 | $18,756 |
| 2019 | $648 | $20,465 | $2,828 | $17,637 |
| 2018 | $625 | $19,154 | $2,828 | $16,326 |
| 2017 | $614 | $18,506 | $2,828 | $15,678 |
| 2016 | $606 | $17,935 | $2,800 | $15,135 |
| 2015 | $474 | $17,935 | $2,800 | $15,135 |
| 2014 | $474 | $17,935 | $2,800 | $15,135 |
Source: Public Records
Map
Nearby Homes
- 7 Willingham St SW
- 14 Clover St SW
- 2108 Maple Ave SW
- 111 Hosea St SW
- 2014 Maple Ave SW
- 304 E 19th St SW
- 107 E Linden St SE
- 1705 Olmstead St SW
- 1901 Hull Ave SW
- 414 E 17th St SW
- 0 Martha Berry Hwy Unit 7525627
- 0 Martha Berry Hwy Unit 7614774
- 0 Martha Berry Hwy Unit 10563404
- 2501 Maple Rd SE
- 2508 Maple Rd SE
- 2107 Rockmart Rd SE
- 000 E Oglethorpe Hwy
- 1502 Spring Creek St SW
- 39 E 16th St SW
- 2523 Maple Rd SE
- 25 Willingham St SW
- 31 Willingham St SW
- 22 Worsham St SW
- 24 Worsham St SW
- 19 Willingham St SW
- 26 Willingham St SW
- 28 Willingham St SW
- 26 Worsham St SW
- 16 Worsham St SW
- 30 Willingham St SW
- 30 Willingham St SW
- 22 Willingham St SW
- 17 Willingham St SW
- 28 Worsham St SW
- 35 Willingham St SW
- 14 Worsham St SW
- 34 Willingham St SW
- 21 Worsham St SW
- 15 Worsham St SW
- 15 Worsham St SW