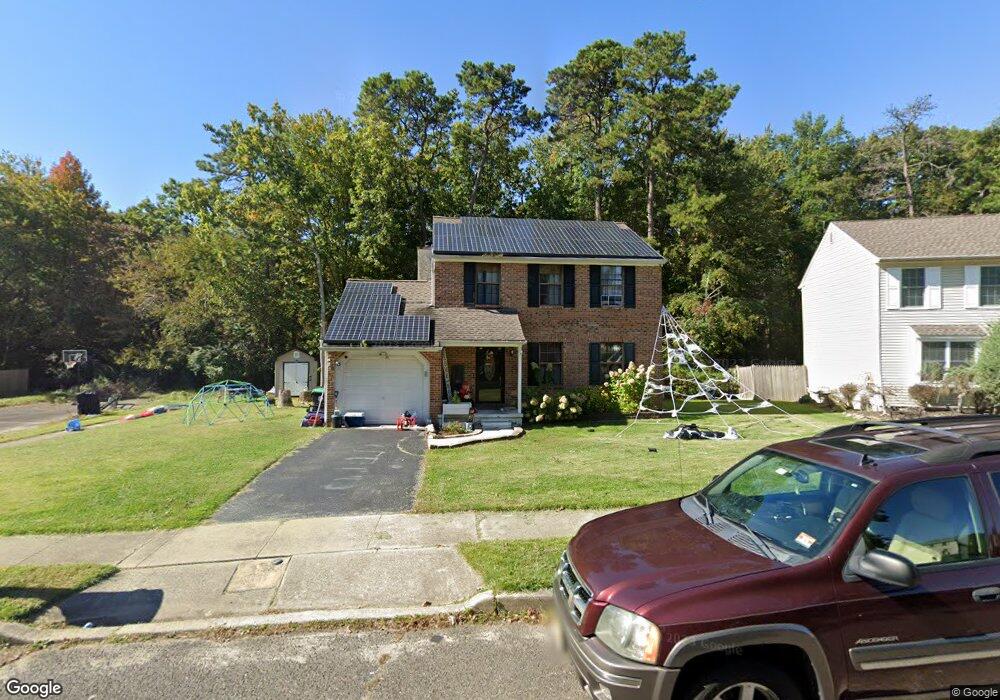
27 Wilton Way Sicklerville, NJ 08081
Winslow Township NeighborhoodEstimated Value: $358,341 - $382,000
3
Beds
3
Baths
1,682
Sq Ft
$220/Sq Ft
Est. Value
About This Home
This home is located at 27 Wilton Way, Sicklerville, NJ 08081 and is currently estimated at $370,085, approximately $220 per square foot. 27 Wilton Way is a home located in Camden County with nearby schools including Winslow Township High School, South Jersey Christian Academy, and St. Mary School.
Ownership History
Date
Name
Owned For
Owner Type
Purchase Details
Closed on
Mar 4, 2009
Sold by
South Jersey Homes Inc
Bought by
Mignano David M and Mignano Jessica M
Current Estimated Value
Home Financials for this Owner
Home Financials are based on the most recent Mortgage that was taken out on this home.
Original Mortgage
$193,431
Outstanding Balance
$123,061
Interest Rate
5.14%
Mortgage Type
FHA
Estimated Equity
$247,024
Purchase Details
Closed on
Oct 14, 2008
Sold by
Green James A and Rouff Michael I
Bought by
South Jersey Homjes Inc
Home Financials for this Owner
Home Financials are based on the most recent Mortgage that was taken out on this home.
Original Mortgage
$101,600
Interest Rate
5.83%
Mortgage Type
New Conventional
Purchase Details
Closed on
Jan 13, 1996
Sold by
Bisant Donald W
Bought by
Brodnyan Charles J and Fowler Cynthia J
Home Financials for this Owner
Home Financials are based on the most recent Mortgage that was taken out on this home.
Original Mortgage
$130,000
Interest Rate
7.16%
Create a Home Valuation Report for This Property
The Home Valuation Report is an in-depth analysis detailing your home's value as well as a comparison with similar homes in the area
Home Values in the Area
Average Home Value in this Area
Purchase History
| Date | Buyer | Sale Price | Title Company |
|---|---|---|---|
| Mignano David M | $197,000 | -- | |
| South Jersey Homjes Inc | $94,094 | -- | |
| Brodnyan Charles J | $104,900 | -- |
Source: Public Records
Mortgage History
| Date | Status | Borrower | Loan Amount |
|---|---|---|---|
| Open | Mignano David M | $193,431 | |
| Previous Owner | South Jersey Homjes Inc | $101,600 | |
| Previous Owner | Brodnyan Charles J | $130,000 |
Source: Public Records
Tax History Compared to Growth
Tax History
| Year | Tax Paid | Tax Assessment Tax Assessment Total Assessment is a certain percentage of the fair market value that is determined by local assessors to be the total taxable value of land and additions on the property. | Land | Improvement |
|---|---|---|---|---|
| 2025 | $6,454 | $165,400 | $42,000 | $123,400 |
| 2024 | $6,284 | $165,400 | $42,000 | $123,400 |
| 2023 | $6,284 | $165,400 | $42,000 | $123,400 |
| 2022 | $6,090 | $165,400 | $42,000 | $123,400 |
| 2021 | $6,021 | $165,400 | $42,000 | $123,400 |
| 2020 | $5,968 | $165,400 | $42,000 | $123,400 |
| 2019 | $5,931 | $165,400 | $42,000 | $123,400 |
| 2018 | $5,850 | $165,400 | $42,000 | $123,400 |
| 2017 | $5,746 | $165,400 | $42,000 | $123,400 |
| 2016 | $5,673 | $165,400 | $42,000 | $123,400 |
| 2015 | $5,591 | $165,400 | $42,000 | $123,400 |
| 2014 | $5,466 | $165,400 | $42,000 | $123,400 |
Source: Public Records
Map
Nearby Homes
- 4 Belmont Ct
- 1 Woodhaven Way
- 616 Tara Dr
- 611 Tara Dr
- 501 Trinidad Blvd
- 713 Barbados Dr
- 662 Barbados Dr
- 617 Caribbean Way
- 617 Saint Vincent Ct
- 402 Paradise Rd
- 734 Virgin Island Dr
- 722 Virgin Island Dr
- 382 Saint Thomas Blvd
- 544 Saint Kitts Dr
- 552 Doral Dr
- 516 Saint Martin Ct
- 507 Saint Kitts Dr
- 512 Lake Ave
- 546 Williamstown Rd
- 542 Williamstown Rd