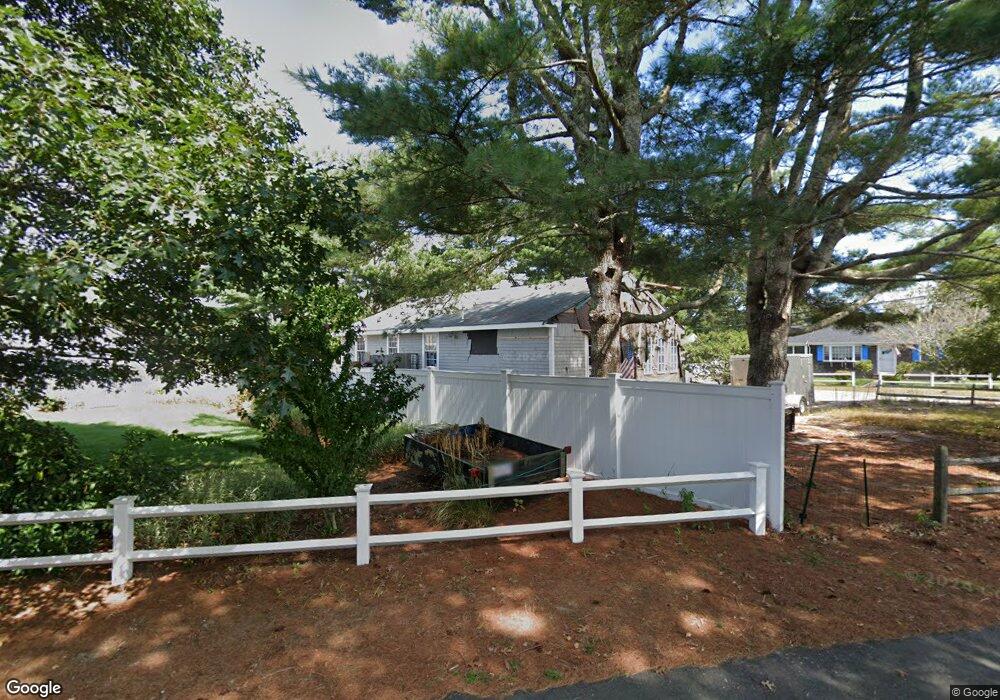
27 Yale Cir Dennis Port, MA 02639
Dennis Port NeighborhoodEstimated Value: $457,000 - $646,000
3
Beds
2
Baths
982
Sq Ft
$545/Sq Ft
Est. Value
About This Home
This home is located at 27 Yale Cir, Dennis Port, MA 02639 and is currently estimated at $535,280, approximately $545 per square foot. 27 Yale Cir is a home located in Barnstable County with nearby schools including Dennis-Yarmouth Regional High School and St. Pius X. School.
Ownership History
Date
Name
Owned For
Owner Type
Purchase Details
Closed on
Mar 2, 2022
Sold by
J F Neilson Income T
Bought by
Renn Edward A and Neilson Barbara A
Current Estimated Value
Home Financials for this Owner
Home Financials are based on the most recent Mortgage that was taken out on this home.
Original Mortgage
$275,000
Outstanding Balance
$256,264
Interest Rate
3.69%
Mortgage Type
Purchase Money Mortgage
Estimated Equity
$279,016
Create a Home Valuation Report for This Property
The Home Valuation Report is an in-depth analysis detailing your home's value as well as a comparison with similar homes in the area
Home Values in the Area
Average Home Value in this Area
Purchase History
| Date | Buyer | Sale Price | Title Company |
|---|---|---|---|
| Renn Edward A | $347,800 | None Available |
Source: Public Records
Mortgage History
| Date | Status | Borrower | Loan Amount |
|---|---|---|---|
| Open | Renn Edward A | $275,000 |
Source: Public Records
Tax History Compared to Growth
Tax History
| Year | Tax Paid | Tax Assessment Tax Assessment Total Assessment is a certain percentage of the fair market value that is determined by local assessors to be the total taxable value of land and additions on the property. | Land | Improvement |
|---|---|---|---|---|
| 2025 | $2,241 | $517,600 | $204,000 | $313,600 |
| 2024 | $2,095 | $477,300 | $196,100 | $281,200 |
| 2023 | $2,026 | $433,900 | $178,300 | $255,600 |
| 2022 | $1,958 | $349,700 | $160,600 | $189,100 |
| 2021 | $2,022 | $335,400 | $180,000 | $155,400 |
| 2020 | $1,820 | $298,400 | $157,500 | $140,900 |
| 2019 | $1,725 | $279,600 | $154,400 | $125,200 |
| 2018 | $1,666 | $262,700 | $147,000 | $115,700 |
| 2017 | $1,566 | $254,700 | $136,500 | $118,200 |
| 2016 | $1,604 | $245,700 | $147,000 | $98,700 |
| 2015 | $1,572 | $245,700 | $147,000 | $98,700 |
| 2014 | $1,427 | $224,700 | $126,000 | $98,700 |
Source: Public Records
Map
Nearby Homes
- 19 Standish Way
- 80 Michaels Ave
- 4 Coffey Ln
- 71 Main St
- 31 Easy St
- 22 Wixon Rd
- 125 Main St Unit 3
- 12 Spoonbill Rd
- 72 Bassett Ln
- 15 Woodside Park Rd
- 268 Main St
- 37 Ocean Dr Unit 2
- 95 Center St
- 61 Trotters Ln
- 26 Center St
- 64 Beaten Rd
- 112 Old Wharf Rd Unit E4
- 112 Old Wharf Rd Unit E1
- 3 Pinefield Ln
- 154 Old Wharf Rd Unit 26