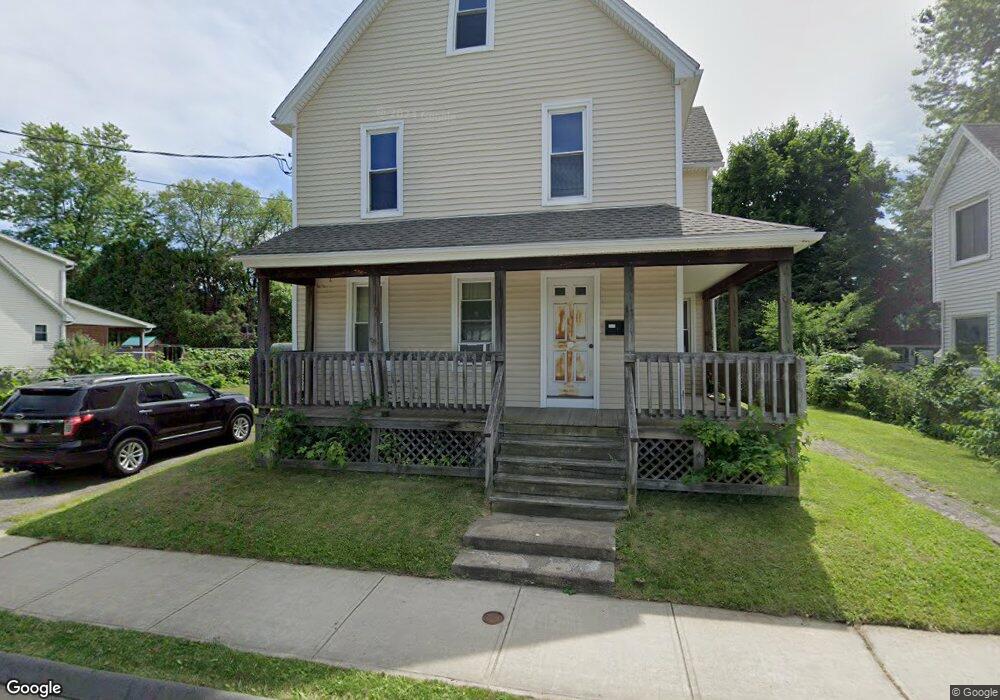
27 Yvonne St Chicopee, MA 01013
Willimansett NeighborhoodEstimated Value: $246,000 - $334,000
4
Beds
2
Baths
1,998
Sq Ft
$150/Sq Ft
Est. Value
About This Home
This home is located at 27 Yvonne St, Chicopee, MA 01013 and is currently estimated at $300,698, approximately $150 per square foot. 27 Yvonne St is a home located in Hampden County with nearby schools including Fairview Elementary School, Bellamy Middle School, and Chicopee Comprehensive High School.
Ownership History
Date
Name
Owned For
Owner Type
Purchase Details
Closed on
Jul 27, 1990
Sold by
Brunault Robert A
Bought by
Moreau Kenneth
Current Estimated Value
Home Financials for this Owner
Home Financials are based on the most recent Mortgage that was taken out on this home.
Original Mortgage
$103,500
Interest Rate
10.01%
Mortgage Type
Purchase Money Mortgage
Create a Home Valuation Report for This Property
The Home Valuation Report is an in-depth analysis detailing your home's value as well as a comparison with similar homes in the area
Home Values in the Area
Average Home Value in this Area
Purchase History
| Date | Buyer | Sale Price | Title Company |
|---|---|---|---|
| Moreau Kenneth | $115,000 | -- |
Source: Public Records
Mortgage History
| Date | Status | Borrower | Loan Amount |
|---|---|---|---|
| Closed | Moreau Kenneth | $103,500 |
Source: Public Records
Tax History Compared to Growth
Tax History
| Year | Tax Paid | Tax Assessment Tax Assessment Total Assessment is a certain percentage of the fair market value that is determined by local assessors to be the total taxable value of land and additions on the property. | Land | Improvement |
|---|---|---|---|---|
| 2025 | $3,500 | $230,900 | $75,500 | $155,400 |
| 2024 | $3,314 | $224,500 | $74,000 | $150,500 |
| 2023 | $3,092 | $204,100 | $67,300 | $136,800 |
| 2022 | $3,023 | $177,900 | $58,500 | $119,400 |
| 2021 | $2,863 | $162,600 | $53,200 | $109,400 |
| 2020 | $2,710 | $155,200 | $53,200 | $102,000 |
| 2019 | $2,653 | $147,700 | $53,200 | $94,500 |
| 2018 | $2,574 | $140,600 | $50,600 | $90,000 |
| 2017 | $2,164 | $125,000 | $50,000 | $75,000 |
| 2016 | $2,097 | $124,000 | $50,000 | $74,000 |
| 2015 | $2,157 | $123,000 | $50,000 | $73,000 |
| 2014 | $1,079 | $123,000 | $50,000 | $73,000 |
Source: Public Records
Map
Nearby Homes
- 26 Olivine St
- 20 Mount Carmel Ave
- 176 Silvin Rd
- 15 Riverview Place
- 21 Tourtelotte Ave
- 91 Norman St
- 18 Charpentier Blvd
- 861 Grattan St
- 3 Henry St
- 162 Pendleton Ave
- 551 Lafleur Dr
- 205 Clemente St
- 196 Pendleton Ave
- 201 Clemente St
- 0 High St
- 47 Dorrance St
- 4 Columbia St
- 5 Vernon St
- 12 Temple St
- 12 Stebbins St