A
Seller's Agent in 2025
Amanda Wiley & K Team
Era All In One Realty
(229) 888-6670
14 in this area
2,615 Total Sales


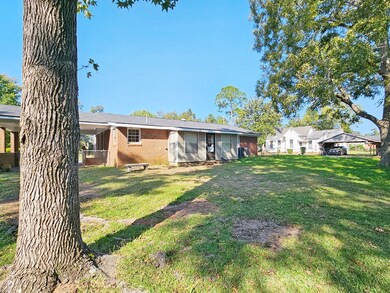


*** NEW IMPROVED PRICE! *** Cute brick home in Cuthbert, GA! Quiet small town living! This adorable home includes 3 bedrooms, 2 full baths and beautiful oak hardwood floors! Updated tile in the kitchen! There is also a separate den/sunroom space! Nearly 2,000 sq ft of living space! Double carport! Fenced backyard! This home is being sold AS IS.
Last Agent to Sell the Property
Era All In One Realty Brokerage Phone: 2298886670 License #309999 Listed on: 11/07/2024
Last Buyer's Agent
Non-Member Agent
Non Member Office
| Date | Type | Sale Price | Title Company |
|---|---|---|---|
| Warranty Deed | $85,000 | -- | |
| Warranty Deed | $55,380 | -- | |
| Warranty Deed | $89,750 | -- | |
| Warranty Deed | $89,750 | -- | |
| Warranty Deed | $48,000 | -- | |
| Warranty Deed | $48,000 | -- | |
| Deed | -- | -- | |
| Deed | -- | -- | |
| Deed | $70,000 | -- | |
| Deed | $70,000 | -- | |
| Deed | -- | -- | |
| Deed | -- | -- | |
| Deed | -- | -- | |
| Deed | -- | -- |
| Date | Status | Loan Amount | Loan Type |
|---|---|---|---|
| Previous Owner | $92,525 | New Conventional |
| Date | Event | Price | List to Sale | Price per Sq Ft |
|---|---|---|---|---|
| 06/15/2025 06/15/25 | Off Market | $79,900 | -- | -- |
| 06/05/2025 06/05/25 | Sold | $85,000 | +6.4% | $43 / Sq Ft |
| 05/09/2025 05/09/25 | Pending | -- | -- | -- |
| 04/28/2025 04/28/25 | Price Changed | $79,900 | -9.1% | $40 / Sq Ft |
| 03/25/2025 03/25/25 | Price Changed | $87,900 | -12.0% | $44 / Sq Ft |
| 02/12/2025 02/12/25 | Price Changed | $99,900 | -9.1% | $50 / Sq Ft |
| 01/03/2025 01/03/25 | Price Changed | $109,900 | -11.3% | $55 / Sq Ft |
| 12/05/2024 12/05/24 | Price Changed | $123,900 | -8.2% | $62 / Sq Ft |
| 11/07/2024 11/07/24 | For Sale | $134,900 | -- | $68 / Sq Ft |
| Year | Tax Paid | Tax Assessment Tax Assessment Total Assessment is a certain percentage of the fair market value that is determined by local assessors to be the total taxable value of land and additions on the property. | Land | Improvement |
|---|---|---|---|---|
| 2024 | $2,566 | $49,648 | $3,880 | $45,768 |
| 2023 | $2,324 | $49,648 | $3,880 | $45,768 |
| 2022 | $1,815 | $49,648 | $3,880 | $45,768 |
| 2021 | $1,129 | $30,361 | $3,259 | $27,102 |
| 2020 | $1,162 | $30,361 | $3,259 | $27,102 |
| 2019 | $730 | $30,361 | $3,259 | $27,102 |
| 2018 | $1,480 | $32,142 | $5,040 | $27,102 |
| 2017 | $1,170 | $32,142 | $5,040 | $27,102 |
| 2016 | $1,173 | $32,142 | $5,040 | $27,102 |
| 2015 | -- | $32,142 | $5,040 | $27,102 |
| 2014 | -- | $29,616 | $5,040 | $24,576 |
| 2013 | -- | $29,616 | $5,040 | $24,576 |
A
Seller's Agent in 2025
Amanda Wiley & K Team
Era All In One Realty
(229) 888-6670
14 in this area
2,615 Total Sales
N
Buyer's Agent in 2025
Non-Member Agent
Non Member Office
Source: Albany Board of REALTORS®
MLS Number: 163926
APN: CU30-002
