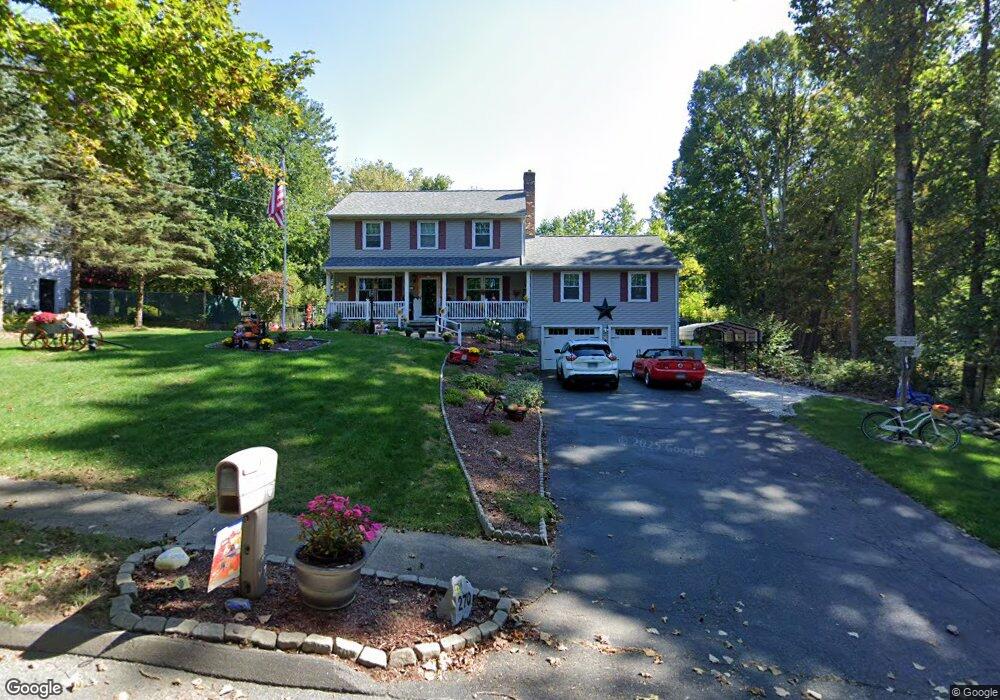
270 Donovan Rd Naugatuck, CT 06770
Estimated Value: $459,546 - $508,000
3
Beds
3
Baths
2,208
Sq Ft
$222/Sq Ft
Est. Value
About This Home
This home is located at 270 Donovan Rd, Naugatuck, CT 06770 and is currently estimated at $490,387, approximately $222 per square foot. 270 Donovan Rd is a home located in New Haven County with nearby schools including City Hill Middle School and Naugatuck High School.
Ownership History
Date
Name
Owned For
Owner Type
Purchase Details
Closed on
Jun 5, 2023
Sold by
Calandro Peter L and Calandro Gail
Bought by
P L & Gail Calandro Ft and Calandro
Current Estimated Value
Purchase Details
Closed on
Aug 17, 1995
Sold by
Keough John and Keough Susan
Bought by
Calandro Peter and Calandro Gail
Home Financials for this Owner
Home Financials are based on the most recent Mortgage that was taken out on this home.
Original Mortgage
$128,000
Interest Rate
7.61%
Mortgage Type
Purchase Money Mortgage
Purchase Details
Closed on
May 3, 1994
Sold by
Carriage Homes
Bought by
Keough John and Keough Susan
Home Financials for this Owner
Home Financials are based on the most recent Mortgage that was taken out on this home.
Original Mortgage
$157,000
Interest Rate
5.75%
Mortgage Type
Purchase Money Mortgage
Create a Home Valuation Report for This Property
The Home Valuation Report is an in-depth analysis detailing your home's value as well as a comparison with similar homes in the area
Home Values in the Area
Average Home Value in this Area
Purchase History
| Date | Buyer | Sale Price | Title Company |
|---|---|---|---|
| P L & Gail Calandro Ft | -- | None Available | |
| Calandro Peter | $160,000 | -- | |
| Keough John | $174,900 | -- |
Source: Public Records
Mortgage History
| Date | Status | Borrower | Loan Amount |
|---|---|---|---|
| Previous Owner | Keough John | $75,000 | |
| Previous Owner | Keough John | $113,000 | |
| Previous Owner | Keough John | $128,000 | |
| Previous Owner | Keough John | $157,000 |
Source: Public Records
Tax History Compared to Growth
Tax History
| Year | Tax Paid | Tax Assessment Tax Assessment Total Assessment is a certain percentage of the fair market value that is determined by local assessors to be the total taxable value of land and additions on the property. | Land | Improvement |
|---|---|---|---|---|
| 2025 | $10,022 | $251,860 | $36,750 | $215,110 |
| 2024 | $10,525 | $251,860 | $36,750 | $215,110 |
| 2023 | $11,271 | $251,860 | $36,750 | $215,110 |
| 2022 | $8,143 | $170,530 | $38,840 | $131,690 |
| 2021 | $8,143 | $170,530 | $38,840 | $131,690 |
| 2020 | $8,143 | $170,530 | $38,840 | $131,690 |
| 2019 | $8,058 | $170,530 | $38,840 | $131,690 |
| 2018 | $8,170 | $168,970 | $54,730 | $114,240 |
| 2017 | $8,155 | $167,980 | $54,730 | $113,250 |
| 2016 | $7,850 | $164,680 | $54,730 | $109,950 |
| 2015 | $7,504 | $164,680 | $54,730 | $109,950 |
| 2014 | $7,420 | $164,680 | $54,730 | $109,950 |
| 2012 | $7,290 | $217,290 | $56,780 | $160,510 |
Source: Public Records
Map
Nearby Homes
- 426 City Hill St
- 24 Windview Dr
- 142 Applewood Ln
- 51 Brook St Unit 6A
- 51 Brook St Unit 5A
- 95 Donovan Rd
- 379 Wooster St
- 187 Lincoln St
- 84 Ruela Dr
- 46 Mulberry St
- 317 City Hill St
- 190 Auburn St
- 137 Maple Hill Rd
- 3 Vine St
- 194 Maple Hill Rd
- 31 June St
- 69 Johnson St
- 45 Johnson St
- 21 Acushnet St
- 146 Johnson St