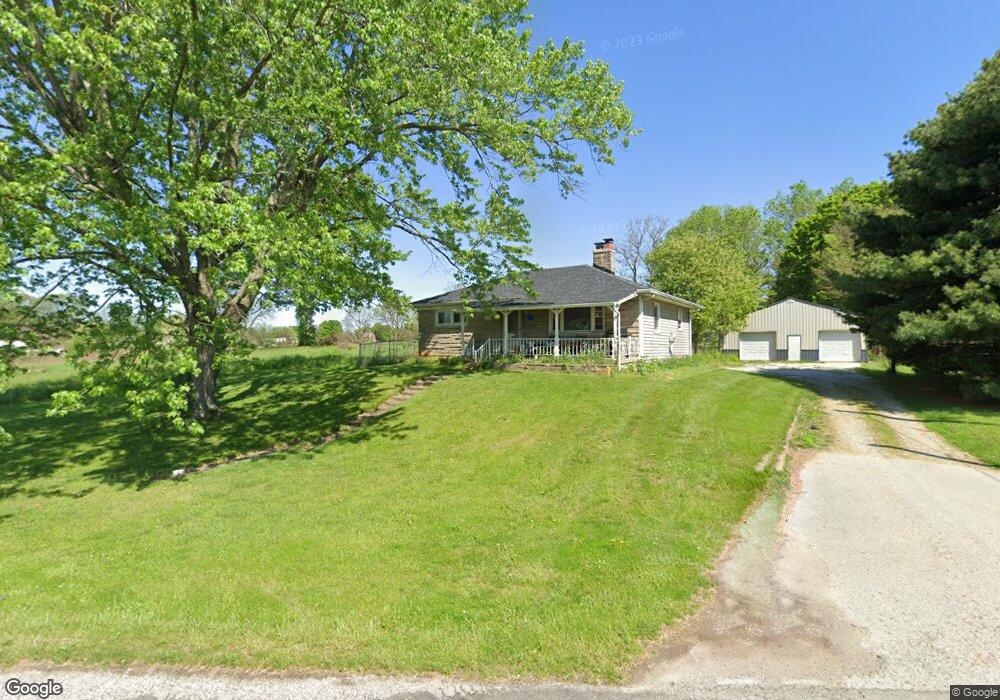
270 E Main St Monrovia, IN 46157
Estimated Value: $225,000 - $328,000
3
Beds
1
Bath
2,052
Sq Ft
$126/Sq Ft
Est. Value
About This Home
This home is located at 270 E Main St, Monrovia, IN 46157 and is currently estimated at $259,549, approximately $126 per square foot. 270 E Main St is a home located in Morgan County with nearby schools including Monrovia Elementary School, Monrovia Middle School, and Monrovia High School.
Ownership History
Date
Name
Owned For
Owner Type
Purchase Details
Closed on
Dec 29, 2011
Sold by
Trammell Cory T and Trammell Fallon M
Bought by
Gentry James R
Current Estimated Value
Home Financials for this Owner
Home Financials are based on the most recent Mortgage that was taken out on this home.
Original Mortgage
$111,224
Outstanding Balance
$76,215
Interest Rate
3.97%
Mortgage Type
New Conventional
Estimated Equity
$183,334
Purchase Details
Closed on
Feb 26, 2009
Sold by
Mayo Brandon J and Mayo Krystal L
Bought by
Trammell Cory T and Trammell Fallon M
Home Financials for this Owner
Home Financials are based on the most recent Mortgage that was taken out on this home.
Original Mortgage
$99,170
Interest Rate
5.09%
Mortgage Type
FHA
Create a Home Valuation Report for This Property
The Home Valuation Report is an in-depth analysis detailing your home's value as well as a comparison with similar homes in the area
Purchase History
| Date | Buyer | Sale Price | Title Company |
|---|---|---|---|
| Gentry James R | -- | None Available | |
| Trammell Cory T | -- | None Available |
Source: Public Records
Mortgage History
| Date | Status | Borrower | Loan Amount |
|---|---|---|---|
| Open | Gentry James R | $111,224 | |
| Previous Owner | Trammell Cory T | $99,170 |
Source: Public Records
Tax History
| Year | Tax Paid | Tax Assessment Tax Assessment Total Assessment is a certain percentage of the fair market value that is determined by local assessors to be the total taxable value of land and additions on the property. | Land | Improvement |
|---|---|---|---|---|
| 2024 | $1,622 | $177,900 | $39,600 | $138,300 |
| 2023 | $1,277 | $178,100 | $39,600 | $138,500 |
| 2022 | $1,375 | $173,400 | $39,600 | $133,800 |
| 2021 | $756 | $147,500 | $25,700 | $121,800 |
| 2020 | $1,133 | $153,600 | $25,700 | $127,900 |
| 2019 | $455 | $108,500 | $16,200 | $92,300 |
| 2018 | $1,004 | $108,700 | $16,200 | $92,500 |
| 2017 | $775 | $101,900 | $16,200 | $85,700 |
| 2016 | $701 | $102,100 | $16,200 | $85,900 |
| 2014 | $354 | $101,900 | $16,200 | $85,700 |
| 2013 | $354 | $102,000 | $16,200 | $85,800 |
Source: Public Records
Map
Nearby Homes
- 60 Terrace Dr
- 0 N West Union Church Rd
- 0 N South R 39
- 10931 N Longbranch St
- 1979 W Gordon Rd
- 2893 W Broderie Ln
- 11111 N Longbranch St
- Lot 1 0 N S R 39
- 0 N Baltimore Rd Unit MBR22079185
- 2976 W Tapestry Dr
- 3079 W Patchwork Dr
- 11373 N State Road 39
- 11108 N Trapunto Ln
- 10950 N Heirloom Dr
- 10960 N Heirloom Dr
- lot 2 0 N S R 39
- 11149 N Sashing Way
- Stamford Plan at Homestead
- Henley Plan at Homestead
- Chatham Plan at Homestead