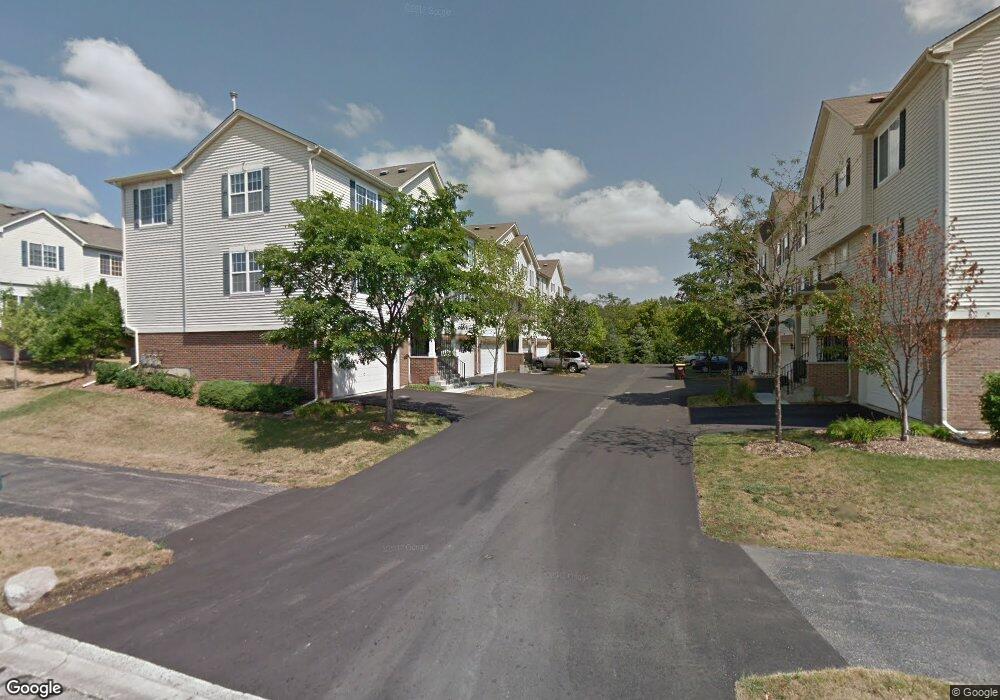
270 Evergreen Cir Unit 5874 Gilberts, IL 60136
Estimated Value: $271,872 - $283,000
3
Beds
3
Baths
1,600
Sq Ft
$173/Sq Ft
Est. Value
About This Home
This home is located at 270 Evergreen Cir Unit 5874, Gilberts, IL 60136 and is currently estimated at $276,718, approximately $172 per square foot. 270 Evergreen Cir Unit 5874 is a home located in Kane County with nearby schools including Gilberts Elementary School, Dundee Middle School, and West Prairie Middle School.
Ownership History
Date
Name
Owned For
Owner Type
Purchase Details
Closed on
Jun 28, 2016
Sold by
Hriljac Brian and Hriljac Gabriella
Bought by
Hiriljac Gabriellla
Current Estimated Value
Purchase Details
Closed on
Jun 20, 2007
Sold by
Thornley Brian and Thornley Tracy
Bought by
Hriljac Brian and Hriljac Gabriella
Home Financials for this Owner
Home Financials are based on the most recent Mortgage that was taken out on this home.
Original Mortgage
$158,400
Interest Rate
6.77%
Mortgage Type
Purchase Money Mortgage
Purchase Details
Closed on
Apr 17, 2003
Sold by
The Ryland Group Inc
Bought by
Thornley Brian and Schader Tracy
Home Financials for this Owner
Home Financials are based on the most recent Mortgage that was taken out on this home.
Original Mortgage
$135,600
Interest Rate
5.78%
Mortgage Type
Purchase Money Mortgage
Create a Home Valuation Report for This Property
The Home Valuation Report is an in-depth analysis detailing your home's value as well as a comparison with similar homes in the area
Home Values in the Area
Average Home Value in this Area
Purchase History
| Date | Buyer | Sale Price | Title Company |
|---|---|---|---|
| Hiriljac Gabriellla | -- | None Available | |
| Hriljac Brian | $198,000 | Ticor Title Insurance Co | |
| Thornley Brian | $170,000 | First American Title Ins Co |
Source: Public Records
Mortgage History
| Date | Status | Borrower | Loan Amount |
|---|---|---|---|
| Previous Owner | Hriljac Brian | $158,400 | |
| Previous Owner | Thornley Brian | $135,600 |
Source: Public Records
Tax History Compared to Growth
Tax History
| Year | Tax Paid | Tax Assessment Tax Assessment Total Assessment is a certain percentage of the fair market value that is determined by local assessors to be the total taxable value of land and additions on the property. | Land | Improvement |
|---|---|---|---|---|
| 2024 | $4,846 | $68,629 | $16,034 | $52,595 |
| 2023 | $4,699 | $62,063 | $14,500 | $47,563 |
| 2022 | $4,611 | $57,222 | $13,369 | $43,853 |
| 2021 | $4,467 | $53,820 | $12,574 | $41,246 |
| 2020 | $4,386 | $52,446 | $12,253 | $40,193 |
| 2019 | $4,265 | $50,337 | $11,760 | $38,577 |
| 2018 | $4,182 | $47,243 | $11,037 | $36,206 |
| 2017 | $4,088 | $44,989 | $10,510 | $34,479 |
| 2016 | $4,011 | $42,831 | $10,006 | $32,825 |
| 2015 | -- | $40,452 | $9,450 | $31,002 |
| 2014 | -- | $36,094 | $8,524 | $27,570 |
| 2013 | -- | $36,755 | $8,680 | $28,075 |
Source: Public Records
Map
Nearby Homes
- 409 Evergreen Cir Unit 4
- 316 Gregory m Sears Dr Unit 8
- 449 Evergreen Cir Unit 6035
- 327 Gregory m Sears Dr Unit 8
- 464 Evergreen Cir Unit 6026
- 125 Augusta Dr Unit 8
- 204 Aspen Cir Unit 1
- 188 Breckenridge Ct Unit 5
- 281 Boulder Ct Unit 6
- 54 Meadows Dr
- 910 Tipperary St
- 0 Tyrrell Rd
- 447 Jean St
- 378 Pierce St
- 14N468 Bonnie Ln
- 193 White Feather Ln
- 215 Tollview Ct
- 152 Jackson St Unit 2821
- 233 Jackson St Unit 2645
- 616 Joy Ln Unit 15
- 244 Evergreen Cir Unit 5853
- 254 Evergreen Cir Unit 5865
- 282 Evergreen Cir Unit 5883
- 316 Evergreen Cir Unit 5913
- 266 Evergreen Cir Unit 5872
- 318 Evergreen Cir Unit 5914
- 290 Evergreen Cir Unit 5892
- 408 Evergreen Cir Unit 5985
- 274 Evergreen Cir Unit 5876
- 298 Evergreen Cir Unit 5896
- 306 Evergreen Cir Unit 5903
- 272 Evergreen Cir Unit 5875
- 376 Evergreen Cir Unit 5964
- 378 Evergreen Cir Unit 5963
- 260 Evergreen Cir Unit 5862
- 242 Evergreen Cir Unit 5852
- 394 Evergreen Cir Unit 5976
- 310 Evergreen Cir Unit 5901
- 248 Evergreen Cir Unit 5855
- 294 Evergreen Cir Unit 5894