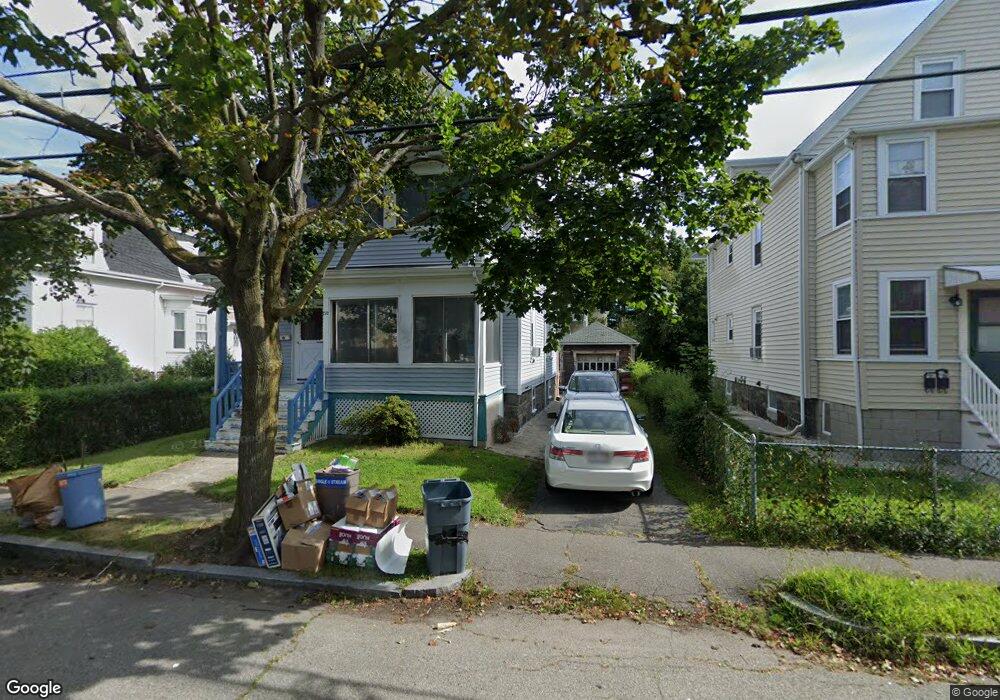
270 Farrington St Quincy, MA 02170
Wollaston NeighborhoodEstimated Value: $857,000 - $1,102,000
5
Beds
2
Baths
2,340
Sq Ft
$425/Sq Ft
Est. Value
About This Home
This home is located at 270 Farrington St, Quincy, MA 02170 and is currently estimated at $994,874, approximately $425 per square foot. 270 Farrington St is a home located in Norfolk County with nearby schools including Wollaston School, Central Middle School, and North Quincy High School.
Ownership History
Date
Name
Owned For
Owner Type
Purchase Details
Closed on
Jun 24, 2005
Sold by
Murphy Neil G
Bought by
Pan Ai J and Lin Hai G
Current Estimated Value
Home Financials for this Owner
Home Financials are based on the most recent Mortgage that was taken out on this home.
Original Mortgage
$328,000
Outstanding Balance
$171,896
Interest Rate
5.82%
Mortgage Type
Purchase Money Mortgage
Estimated Equity
$822,978
Purchase Details
Closed on
Apr 6, 2005
Sold by
Murphy Neil G
Bought by
Spillane David M and Murphy Neil G
Purchase Details
Closed on
Aug 15, 2003
Sold by
Est Conway Maryanne and Conway Helena
Bought by
Murphy Neil G
Home Financials for this Owner
Home Financials are based on the most recent Mortgage that was taken out on this home.
Original Mortgage
$251,000
Interest Rate
5.46%
Mortgage Type
Purchase Money Mortgage
Purchase Details
Closed on
Jan 25, 1994
Sold by
Est Omeara Mildred I and Omeara John J
Bought by
Conway Maryanne
Home Financials for this Owner
Home Financials are based on the most recent Mortgage that was taken out on this home.
Original Mortgage
$146,250
Interest Rate
7.08%
Mortgage Type
Purchase Money Mortgage
Create a Home Valuation Report for This Property
The Home Valuation Report is an in-depth analysis detailing your home's value as well as a comparison with similar homes in the area
Home Values in the Area
Average Home Value in this Area
Purchase History
| Date | Buyer | Sale Price | Title Company |
|---|---|---|---|
| Pan Ai J | $438,000 | -- | |
| Spillane David M | -- | -- | |
| Murphy Neil G | $279,000 | -- | |
| Conway Maryanne | $162,500 | -- |
Source: Public Records
Mortgage History
| Date | Status | Borrower | Loan Amount |
|---|---|---|---|
| Open | Pan Ai J | $328,000 | |
| Previous Owner | Murphy Neil G | $251,000 | |
| Previous Owner | Conway Maryanne | $146,250 |
Source: Public Records
Tax History Compared to Growth
Tax History
| Year | Tax Paid | Tax Assessment Tax Assessment Total Assessment is a certain percentage of the fair market value that is determined by local assessors to be the total taxable value of land and additions on the property. | Land | Improvement |
|---|---|---|---|---|
| 2025 | $9,771 | $847,400 | $342,600 | $504,800 |
| 2024 | $9,379 | $832,200 | $342,600 | $489,600 |
| 2023 | $8,912 | $800,700 | $326,300 | $474,400 |
| 2022 | $8,733 | $729,000 | $283,800 | $445,200 |
| 2021 | $8,715 | $717,900 | $270,300 | $447,600 |
| 2020 | $8,660 | $696,700 | $270,300 | $426,400 |
| 2019 | $8,208 | $654,000 | $252,600 | $401,400 |
| 2018 | $7,731 | $579,500 | $233,900 | $345,600 |
| 2017 | $7,792 | $549,900 | $222,700 | $327,200 |
| 2016 | $6,873 | $478,600 | $193,700 | $284,900 |
| 2015 | $6,482 | $444,000 | $176,100 | $267,900 |
| 2014 | $5,623 | $378,400 | $167,700 | $210,700 |
Source: Public Records
Map
Nearby Homes
- 129 Beale St
- 204 Farrington St
- 143 Arlington St
- 21 Linden St Unit 417
- 511 Hancock St Unit 207
- 522 Hancock St
- 111 Warren Ave Unit 1F
- 22 Beach St
- 225 S Central Ave
- 129 Grand View Ave
- 55 Warren Ave
- 43 Ellington Rd
- 22 Newton Ave
- 260 Elmwood Ave
- 101 Beach St
- 165 Old Colony Ave Unit A
- 39 Fayette St Unit 102
- 57 Willow Ave
- 72 Waterston Ave
- 35 Estabrook Rd
- 276 Farrington St
- 266 Farrington St
- 264 Farrington St
- 275 Fayette St
- 280 Farrington St
- 281 Fayette St
- 269 Fayette St
- 265 Fayette St
- 271 Farrington St
- 275 Farrington St
- 267 Farrington St
- 283 Fayette St
- 284 Farrington St
- 263 Farrington St
- 279 Farrington St Unit 4
- 279 Farrington St Unit 3
- 279 Farrington St Unit 2
- 279 Farrington St Unit 1
- 279 Farrington St Unit 1,279
- 279 Farrington St