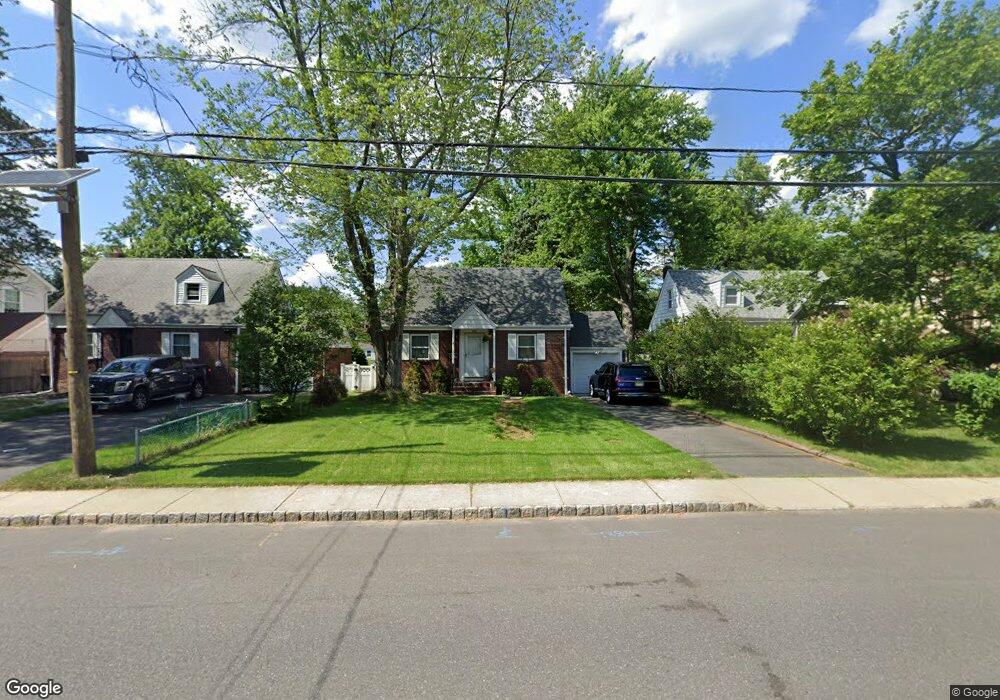
270 Grant Ave Dumont, NJ 07628
Estimated Value: $520,000 - $587,754
--
Bed
--
Bath
1,152
Sq Ft
$478/Sq Ft
Est. Value
About This Home
This home is located at 270 Grant Ave, Dumont, NJ 07628 and is currently estimated at $550,439, approximately $477 per square foot. 270 Grant Ave is a home located in Bergen County with nearby schools including Dumont High School.
Ownership History
Date
Name
Owned For
Owner Type
Purchase Details
Closed on
Aug 27, 2015
Sold by
Bourke Brian and Bourke Danielle
Bought by
Rodriguez Warth Katharina and Rodriguez Zuniga Miguel A
Current Estimated Value
Home Financials for this Owner
Home Financials are based on the most recent Mortgage that was taken out on this home.
Original Mortgage
$220,000
Outstanding Balance
$173,383
Interest Rate
4.01%
Mortgage Type
New Conventional
Estimated Equity
$377,056
Purchase Details
Closed on
May 19, 2010
Sold by
Betancur Ligia and Sauter James
Bought by
Bourke Brian and Kaszuba Danielle
Home Financials for this Owner
Home Financials are based on the most recent Mortgage that was taken out on this home.
Original Mortgage
$254,375
Interest Rate
5.37%
Mortgage Type
FHA
Purchase Details
Closed on
Oct 11, 2000
Sold by
Voisenat Mary
Bought by
Trammell Ligia
Home Financials for this Owner
Home Financials are based on the most recent Mortgage that was taken out on this home.
Original Mortgage
$55,000
Interest Rate
7.7%
Create a Home Valuation Report for This Property
The Home Valuation Report is an in-depth analysis detailing your home's value as well as a comparison with similar homes in the area
Home Values in the Area
Average Home Value in this Area
Purchase History
| Date | Buyer | Sale Price | Title Company |
|---|---|---|---|
| Rodriguez Warth Katharina | $275,000 | Attorney | |
| Bourke Brian | $289,000 | -- | |
| Trammell Ligia | $90,000 | -- |
Source: Public Records
Mortgage History
| Date | Status | Borrower | Loan Amount |
|---|---|---|---|
| Open | Rodriguez Warth Katharina | $220,000 | |
| Previous Owner | Bourke Brian | $254,375 | |
| Previous Owner | Trammell Ligia | $55,000 |
Source: Public Records
Tax History Compared to Growth
Tax History
| Year | Tax Paid | Tax Assessment Tax Assessment Total Assessment is a certain percentage of the fair market value that is determined by local assessors to be the total taxable value of land and additions on the property. | Land | Improvement |
|---|---|---|---|---|
| 2025 | $10,728 | $465,100 | $299,300 | $165,800 |
| 2024 | $10,464 | $263,900 | $175,800 | $88,100 |
| 2023 | $10,247 | $263,900 | $175,800 | $88,100 |
| 2022 | $10,247 | $263,900 | $175,800 | $88,100 |
| 2021 | $10,197 | $263,900 | $175,800 | $88,100 |
| 2020 | $9,920 | $263,900 | $175,800 | $88,100 |
| 2019 | $9,682 | $263,900 | $175,800 | $88,100 |
| 2018 | $9,485 | $263,900 | $175,800 | $88,100 |
| 2017 | $9,302 | $263,900 | $175,800 | $88,100 |
| 2016 | $9,086 | $263,900 | $175,800 | $88,100 |
| 2015 | $8,878 | $263,900 | $175,800 | $88,100 |
| 2014 | $8,703 | $263,900 | $175,800 | $88,100 |
Source: Public Records
Map
Nearby Homes
- 15 Burns Place
- 15 Laurel Ave
- 5 Campi Ct
- 150 Lenox Ave
- 7 Burton Place
- 120 Larch Ave
- 48 Colonial Pkwy
- 156 E Linden Ave
- 35 Wolcott Rd
- 13 Poplar St
- 41 Monument Place
- 279 Jefferson Ave
- 72 Roosevelt St
- 123 Pearl St
- 28 Wood Place
- 51 Wood Place
- 149 Heatherhill Rd
- 254 Concord St
- 51 Harrison St
- 34 Summit Place