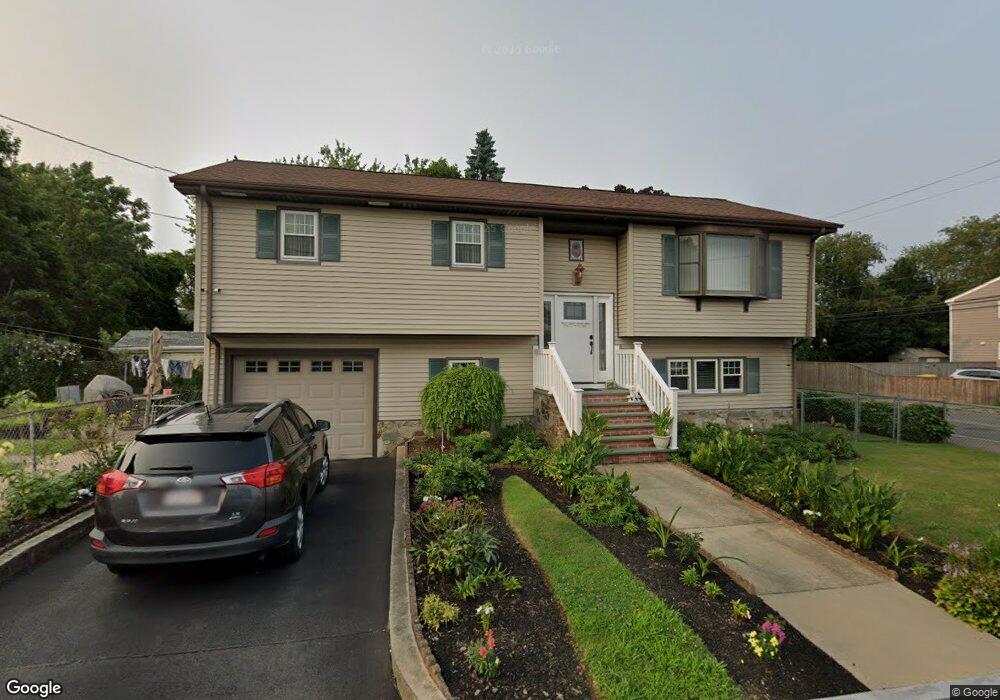
270 Henry St Fall River, MA 02721
Maplewood NeighborhoodEstimated Value: $474,071 - $524,000
3
Beds
3
Baths
1,926
Sq Ft
$262/Sq Ft
Est. Value
About This Home
This home is located at 270 Henry St, Fall River, MA 02721 and is currently estimated at $505,018, approximately $262 per square foot. 270 Henry St is a home located in Bristol County with nearby schools including Henry Lord Community School, B M C Durfee High School, and Argosy Collegiate Charter School.
Ownership History
Date
Name
Owned For
Owner Type
Purchase Details
Closed on
Apr 4, 2023
Sold by
Ledo Manuel M and Ledo Mary F
Bought by
Ledo Irt and Ledo
Current Estimated Value
Create a Home Valuation Report for This Property
The Home Valuation Report is an in-depth analysis detailing your home's value as well as a comparison with similar homes in the area
Home Values in the Area
Average Home Value in this Area
Purchase History
| Date | Buyer | Sale Price | Title Company |
|---|---|---|---|
| Ledo Irt | -- | None Available |
Source: Public Records
Tax History
| Year | Tax Paid | Tax Assessment Tax Assessment Total Assessment is a certain percentage of the fair market value that is determined by local assessors to be the total taxable value of land and additions on the property. | Land | Improvement |
|---|---|---|---|---|
| 2025 | $5,166 | $451,200 | $126,800 | $324,400 |
| 2024 | $4,581 | $398,700 | $122,000 | $276,700 |
| 2023 | $4,398 | $358,400 | $104,600 | $253,800 |
| 2022 | $3,781 | $301,300 | $95,100 | $206,200 |
| 2021 | $3,781 | $273,400 | $88,000 | $185,400 |
| 2020 | $3,186 | $220,500 | $84,200 | $136,300 |
| 2019 | $3,157 | $216,500 | $80,200 | $136,300 |
| 2018 | $3,003 | $205,400 | $78,700 | $126,700 |
| 2017 | $2,883 | $205,900 | $80,300 | $125,600 |
| 2016 | $2,768 | $203,100 | $83,600 | $119,500 |
| 2015 | $2,466 | $188,500 | $80,500 | $108,000 |
| 2014 | $2,425 | $192,800 | $84,800 | $108,000 |
Source: Public Records
Map
Nearby Homes
Your Personal Tour Guide
Ask me questions while you tour the home.