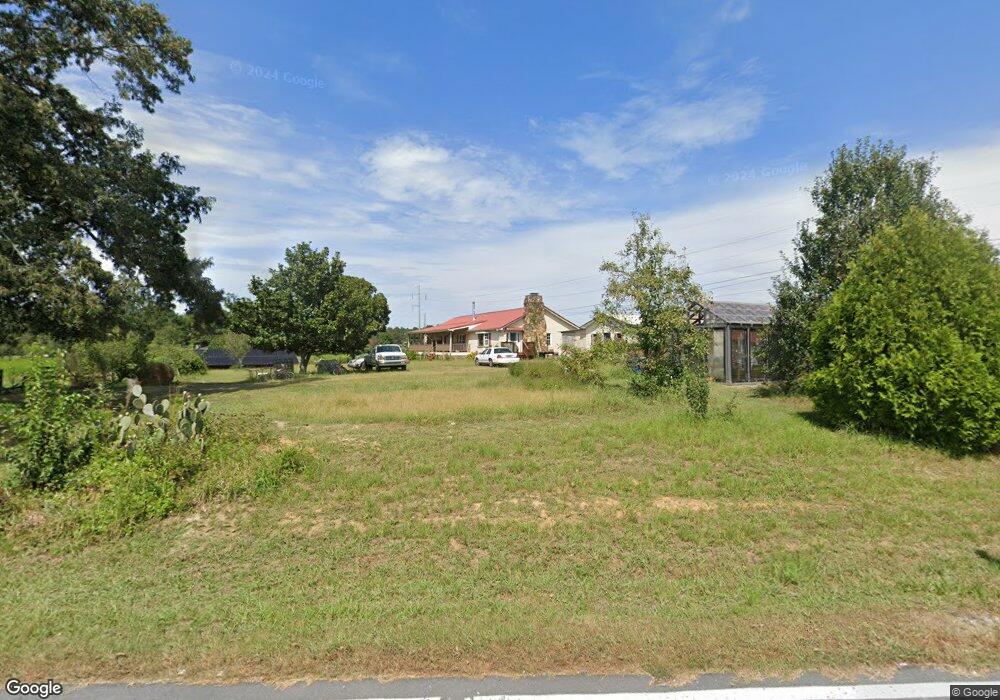
270 Jim Petty Rd Crandall, GA 30711
Cisco NeighborhoodEstimated Value: $283,019 - $325,000
3
Beds
2
Baths
2,070
Sq Ft
$147/Sq Ft
Est. Value
About This Home
This home is located at 270 Jim Petty Rd, Crandall, GA 30711 and is currently estimated at $304,505, approximately $147 per square foot. 270 Jim Petty Rd is a home located in Murray County with nearby schools including Northwest Elementary School, Bagley Middle School, and North Murray High School.
Ownership History
Date
Name
Owned For
Owner Type
Purchase Details
Closed on
Sep 14, 2020
Sold by
Michal Paul
Bought by
Michal Paul and Michal Rachel
Current Estimated Value
Home Financials for this Owner
Home Financials are based on the most recent Mortgage that was taken out on this home.
Original Mortgage
$77,200
Outstanding Balance
$53,655
Interest Rate
2.9%
Mortgage Type
New Conventional
Estimated Equity
$250,850
Purchase Details
Closed on
Apr 28, 2006
Sold by
Federal National Mortgage Association
Bought by
Michael Paul L
Home Financials for this Owner
Home Financials are based on the most recent Mortgage that was taken out on this home.
Original Mortgage
$117,161
Interest Rate
6.33%
Mortgage Type
FHA
Purchase Details
Closed on
Sep 6, 2005
Sold by
Regions Bank
Bought by
Federal National Mtg Associati
Purchase Details
Closed on
May 16, 2000
Sold by
Mullins Phyllis
Bought by
Mullins Lloyd
Create a Home Valuation Report for This Property
The Home Valuation Report is an in-depth analysis detailing your home's value as well as a comparison with similar homes in the area
Home Values in the Area
Average Home Value in this Area
Purchase History
| Date | Buyer | Sale Price | Title Company |
|---|---|---|---|
| Michal Paul | -- | -- | |
| Michael Paul L | $119,000 | -- | |
| Federal National Mtg Associati | $99,431 | -- | |
| Regions Bank | $99,431 | -- | |
| Mullins Lloyd | -- | -- |
Source: Public Records
Mortgage History
| Date | Status | Borrower | Loan Amount |
|---|---|---|---|
| Open | Michal Paul | $77,200 | |
| Previous Owner | Michael Paul L | $117,161 |
Source: Public Records
Tax History Compared to Growth
Tax History
| Year | Tax Paid | Tax Assessment Tax Assessment Total Assessment is a certain percentage of the fair market value that is determined by local assessors to be the total taxable value of land and additions on the property. | Land | Improvement |
|---|---|---|---|---|
| 2024 | $2,459 | $106,576 | $4,960 | $101,616 |
| 2023 | $2,393 | $101,744 | $4,960 | $96,784 |
| 2022 | $1,875 | $80,144 | $4,720 | $75,424 |
| 2021 | $1,529 | $64,144 | $4,720 | $59,424 |
| 2020 | $1,313 | $55,384 | $4,480 | $50,904 |
| 2019 | $1,228 | $51,744 | $3,200 | $48,544 |
| 2018 | $1,228 | $51,744 | $3,200 | $48,544 |
| 2017 | $0 | $45,464 | $3,200 | $42,264 |
| 2016 | $963 | $44,452 | $7,760 | $36,692 |
| 2015 | -- | $44,452 | $7,760 | $36,692 |
| 2014 | -- | $44,452 | $7,760 | $36,692 |
| 2013 | -- | $44,452 | $7,760 | $36,692 |
Source: Public Records
Map
Nearby Homes
- 247 Ac Maddron Rd
- 10104 Georgia 225 Unit 4
- 242 AC Maddron Rd
- 205+ Ac Maddron Rd
- 00 Georgia 2
- 0 Georgia 2
- 1371 Halls Chapel Rd
- 0 Baxter Rd
- 1339 Richard Bennett Rd
- 37 Ac Carson Ave
- 37 Acres Carson Ave
- 19 Highway 411
- 10000 Georgia 225
- Landlot 19 Highway 411
- 9338 Hwy 255n
- 44 Brush Town Rd
- 14705 Georgia Highway 225 N
- 160 Fairy Valley Dr
- 910 Brushtown Rd
- 00 Halls Chapel Rd
- 379 Jim Petty Rd
- 80 Jim Petty Rd
- 62 Jim Petty Rd
- 418 Jim Petty Rd
- 223 Jim Petty Rd
- 1750 Temple Grove Rd
- 1540 Temple Grove Rd
- 1540 Temple Grove Rd
- 00 Jim Petty Rd
- 1488 Temple Grove Rd
- 464 Jim Petty Rd
- 483 Jim Petty Rd
- 481 Jim Petty Rd
- 526 Jim Petty Rd
- 1892 Temple Grove Rd
- 479 Jim Petty Rd
- 454 Jim Petty Rd
- 1471 Temple Grove Rd
- 562 Jim Petty Rd
- 1511 Temple Grove Rd