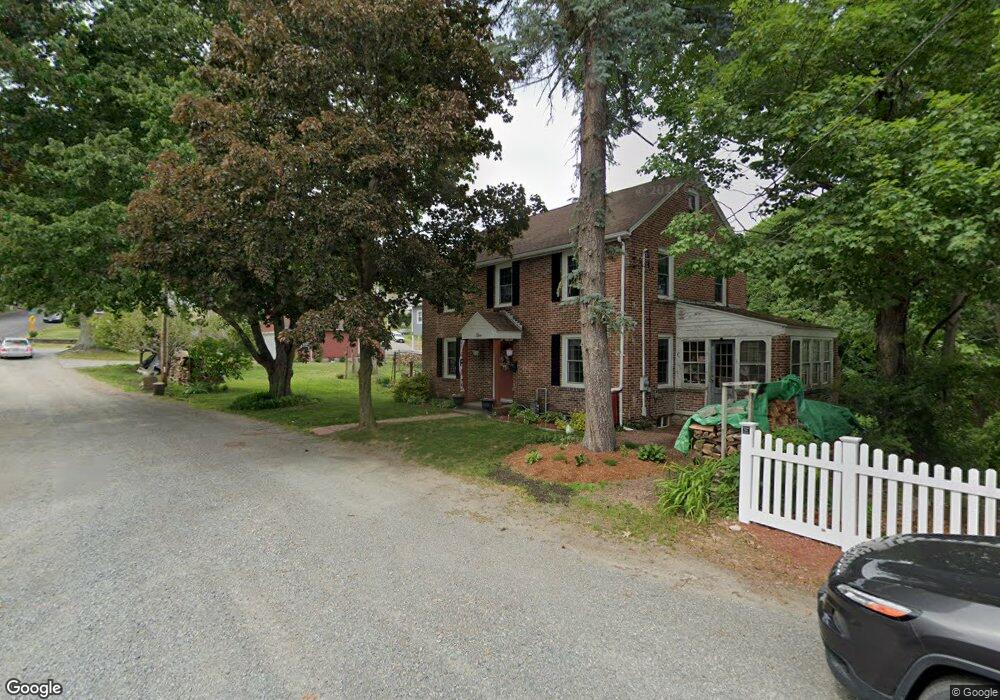
270 June St Worcester, MA 01602
Columbus Park NeighborhoodEstimated Value: $532,000 - $621,000
4
Beds
3
Baths
2,122
Sq Ft
$264/Sq Ft
Est. Value
About This Home
This home is located at 270 June St, Worcester, MA 01602 and is currently estimated at $559,513, approximately $263 per square foot. 270 June St is a home located in Worcester County with nearby schools including Chandler Magnet, Jacob Hiatt Magnet School, and May Street Elementary School.
Ownership History
Date
Name
Owned For
Owner Type
Purchase Details
Closed on
Aug 30, 2017
Sold by
Thach Lavy
Bought by
Gasu Emmanuel A
Current Estimated Value
Home Financials for this Owner
Home Financials are based on the most recent Mortgage that was taken out on this home.
Original Mortgage
$260,775
Outstanding Balance
$218,116
Interest Rate
3.96%
Mortgage Type
New Conventional
Estimated Equity
$341,397
Purchase Details
Closed on
Oct 15, 2001
Sold by
Noonan Timothy P
Bought by
Thach Lavy
Purchase Details
Closed on
May 21, 1996
Sold by
Kyes Robert G and Kyes Barbara
Bought by
Noonan Timothy P
Create a Home Valuation Report for This Property
The Home Valuation Report is an in-depth analysis detailing your home's value as well as a comparison with similar homes in the area
Home Values in the Area
Average Home Value in this Area
Purchase History
| Date | Buyer | Sale Price | Title Company |
|---|---|---|---|
| Gasu Emmanuel A | $274,500 | -- | |
| Thach Lavy | $219,900 | -- | |
| Noonan Timothy P | $131,500 | -- |
Source: Public Records
Mortgage History
| Date | Status | Borrower | Loan Amount |
|---|---|---|---|
| Open | Gasu Emmanuel A | $260,775 | |
| Previous Owner | Noonan Timothy P | $180,000 | |
| Previous Owner | Noonan Timothy P | $160,000 |
Source: Public Records
Tax History
| Year | Tax Paid | Tax Assessment Tax Assessment Total Assessment is a certain percentage of the fair market value that is determined by local assessors to be the total taxable value of land and additions on the property. | Land | Improvement |
|---|---|---|---|---|
| 2025 | $5,853 | $443,752 | $142,552 | $301,200 |
| 2024 | $4,794 | $348,652 | $142,552 | $206,100 |
| 2023 | $4,580 | $319,406 | $123,806 | $195,600 |
| 2022 | $3,092 | $203,289 | $140,389 | $62,900 |
| 2021 | $5,574 | $342,373 | $112,373 | $230,000 |
| 2020 | $5,256 | $309,200 | $112,400 | $196,800 |
| 2019 | $5,047 | $280,400 | $101,200 | $179,200 |
| 2018 | $5,066 | $267,900 | $101,200 | $166,700 |
| 2017 | $4,890 | $254,400 | $101,200 | $153,200 |
| 2016 | $4,718 | $228,900 | $74,300 | $154,600 |
| 2015 | $4,594 | $228,900 | $74,300 | $154,600 |
| 2014 | $4,473 | $228,900 | $74,300 | $154,600 |
Source: Public Records
Map
Nearby Homes
- 6 Ludington Rd
- 34 Rosslare Dr Unit 108
- 211 June St Unit B
- 5 Swan Ave
- 32 Zenith Dr
- 22 Outlook Dr
- 415 Mill St
- 215 Mill St Unit 113
- 24 Geneva St
- 10 Minthorne St
- 9 Fiske St Unit A
- 57 1st St
- 28 Walworth St
- 16 Sherwood Rd
- 33 Carlisle St
- 34 Scandinavia Ave
- 114 Lovell St
- 24 Hadwen Rd
- 47R Yarnie Unit 3A
- 47R Yarnie Unit 1B
Your Personal Tour Guide
Ask me questions while you tour the home.