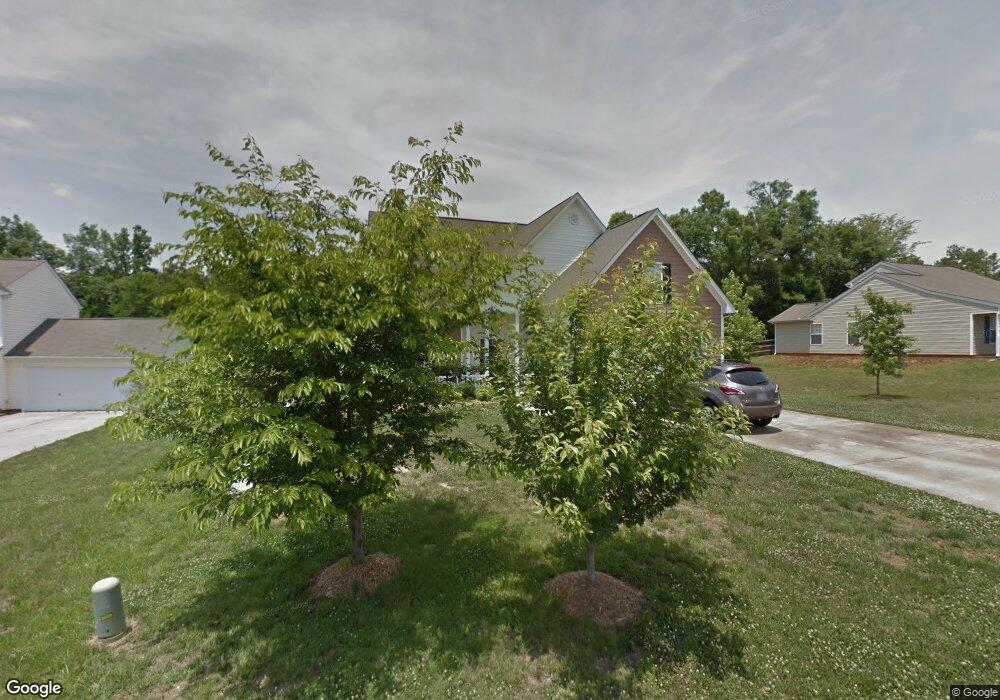
270 Kendra Dr SW Concord, NC 28025
Estimated Value: $360,000 - $406,000
4
Beds
3
Baths
2,099
Sq Ft
$178/Sq Ft
Est. Value
About This Home
This home is located at 270 Kendra Dr SW, Concord, NC 28025 and is currently estimated at $374,395, approximately $178 per square foot. 270 Kendra Dr SW is a home located in Cabarrus County with nearby schools including Rocky River Elementary School, J.N. Fries Middle School, and Branch Christian Academy.
Ownership History
Date
Name
Owned For
Owner Type
Purchase Details
Closed on
Apr 11, 2008
Sold by
Flood Billy and Flood Florence
Bought by
Wade Katherine A and Wade William
Current Estimated Value
Home Financials for this Owner
Home Financials are based on the most recent Mortgage that was taken out on this home.
Original Mortgage
$120,000
Outstanding Balance
$77,000
Interest Rate
6.22%
Mortgage Type
Purchase Money Mortgage
Estimated Equity
$297,395
Purchase Details
Closed on
Dec 22, 2003
Sold by
Craft Homes Usa Llc
Bought by
Flood Billy and Flood Florence
Home Financials for this Owner
Home Financials are based on the most recent Mortgage that was taken out on this home.
Original Mortgage
$146,840
Interest Rate
5.97%
Mortgage Type
FHA
Purchase Details
Closed on
Mar 10, 2003
Sold by
Bw Homes Inc
Bought by
Craft Homes Usa Llc
Purchase Details
Closed on
Nov 1, 1996
Bought by
B W Homes Inc
Create a Home Valuation Report for This Property
The Home Valuation Report is an in-depth analysis detailing your home's value as well as a comparison with similar homes in the area
Home Values in the Area
Average Home Value in this Area
Purchase History
| Date | Buyer | Sale Price | Title Company |
|---|---|---|---|
| Wade Katherine A | $150,000 | None Available | |
| Flood Billy | $148,000 | -- | |
| Craft Homes Usa Llc | $371,000 | -- | |
| B W Homes Inc | -- | -- |
Source: Public Records
Mortgage History
| Date | Status | Borrower | Loan Amount |
|---|---|---|---|
| Open | Wade Katherine A | $120,000 | |
| Previous Owner | Flood Billy | $146,840 |
Source: Public Records
Tax History
| Year | Tax Paid | Tax Assessment Tax Assessment Total Assessment is a certain percentage of the fair market value that is determined by local assessors to be the total taxable value of land and additions on the property. | Land | Improvement |
|---|---|---|---|---|
| 2025 | $3,453 | $346,730 | $80,000 | $266,730 |
| 2024 | $3,453 | $346,730 | $80,000 | $266,730 |
| 2023 | $2,589 | $212,210 | $41,000 | $171,210 |
| 2022 | $2,559 | $209,730 | $41,000 | $168,730 |
| 2021 | $2,559 | $209,730 | $41,000 | $168,730 |
| 2020 | $2,559 | $209,730 | $41,000 | $168,730 |
| 2019 | $2,223 | $182,190 | $25,000 | $157,190 |
| 2018 | $2,186 | $182,190 | $25,000 | $157,190 |
| 2017 | $2,150 | $182,190 | $25,000 | $157,190 |
| 2016 | $1,275 | $175,240 | $25,000 | $150,240 |
| 2015 | $2,068 | $175,240 | $25,000 | $150,240 |
| 2014 | $2,068 | $175,240 | $25,000 | $150,240 |
Source: Public Records
Map
Nearby Homes
- 4294 Kiser Woods Dr SW
- 4274 Kiser Woods Dr SW
- 1123 Burning Embers Ln SW
- 308 Patrick Ave SW
- 1153 Burning Embers Ln SW
- 1079 Matchstick Place SW
- 4227 Kiser Woods Dr SW
- 1150 Hearth Ln SW
- 4436 Falls Lake Dr SW
- 5356 Zion Church Rd
- 632 Treasure Dr SW
- 910/820 Archibald Rd
- 123 Softwind Ln
- 15 Search Dr
- 1130 Brigadoon Ct
- 518 Viking Place SW
- 608 Nannyberry Ln
- 4194 Clifftonville Ave SW
- 1234 Piney Church Rd
- 3928 Old Glory Dr
- 274 Kendra Dr SW
- 266 Kendra Dr SW
- 262 Kendra Dr SW
- 278 Kendra Dr SW
- 273 Kendra Dr SW
- 269 Kendra Dr SW
- 282 Kendra Dr SW
- 268 Kendra Dr SW
- 265 Kendra Dr SW
- 277 Kendra Dr SW
- 258 Kendra Dr SW
- 261 Kendra Dr SW
- 257 Kendra Dr SW
- 4232 Sebring Ct SW
- 4236 Sebring Ct SW
- 254 Kendra Dr SW
- 4240 Sebring Ct SW
- 4240 Sebring Ct SW Unit 134
- 4224 Sebring Ct SW
- 4228 Sebring Ct SW