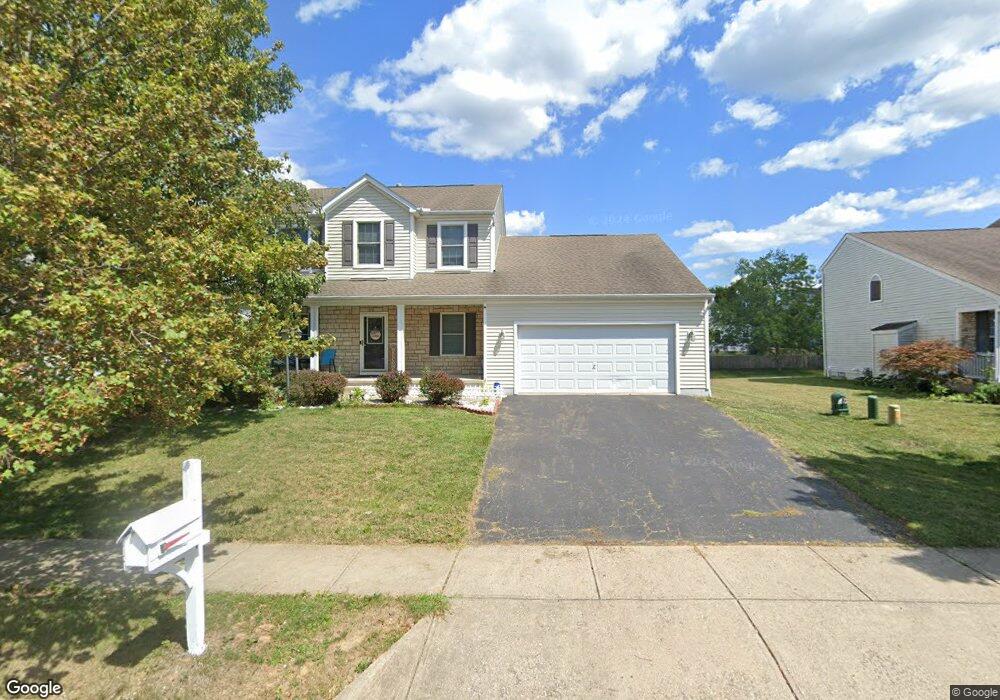
270 Linden Cir Pickerington, OH 43147
Estimated Value: $421,000 - $471,000
4
Beds
3
Baths
2,392
Sq Ft
$184/Sq Ft
Est. Value
About This Home
This home is located at 270 Linden Cir, Pickerington, OH 43147 and is currently estimated at $440,064, approximately $183 per square foot. 270 Linden Cir is a home located in Fairfield County with nearby schools including Sycamore Creek Elementary School, Diley Middle School, and Pickerington Ridgeview Junior High School.
Ownership History
Date
Name
Owned For
Owner Type
Purchase Details
Closed on
Nov 14, 2022
Sold by
Perkins Emily F and Perkins David M
Bought by
Odei Ernest and Adjei Rebecca
Current Estimated Value
Home Financials for this Owner
Home Financials are based on the most recent Mortgage that was taken out on this home.
Original Mortgage
$378,026
Outstanding Balance
$364,743
Interest Rate
6.94%
Mortgage Type
FHA
Estimated Equity
$75,321
Purchase Details
Closed on
Nov 11, 2022
Sold by
Perkins Emily F and Perkins David M
Bought by
Odei Ernest and Adjei Rebecca
Home Financials for this Owner
Home Financials are based on the most recent Mortgage that was taken out on this home.
Original Mortgage
$378,026
Outstanding Balance
$364,743
Interest Rate
6.94%
Mortgage Type
FHA
Estimated Equity
$75,321
Purchase Details
Closed on
Jun 25, 2004
Sold by
Dominion Homes Inc
Bought by
Perkins David M and Perkins Emily F
Home Financials for this Owner
Home Financials are based on the most recent Mortgage that was taken out on this home.
Original Mortgage
$187,900
Interest Rate
4.62%
Mortgage Type
Purchase Money Mortgage
Create a Home Valuation Report for This Property
The Home Valuation Report is an in-depth analysis detailing your home's value as well as a comparison with similar homes in the area
Home Values in the Area
Average Home Value in this Area
Purchase History
| Date | Buyer | Sale Price | Title Company |
|---|---|---|---|
| Odei Ernest | $385,000 | None Listed On Document | |
| Odei Ernest | $385,000 | -- | |
| Perkins David M | $234,900 | Alliance Title |
Source: Public Records
Mortgage History
| Date | Status | Borrower | Loan Amount |
|---|---|---|---|
| Open | Odei Ernest | $378,026 | |
| Closed | Odei Ernest | $378,026 | |
| Previous Owner | Perkins David M | $187,900 | |
| Closed | Perkins David M | $46,975 |
Source: Public Records
Tax History
| Year | Tax Paid | Tax Assessment Tax Assessment Total Assessment is a certain percentage of the fair market value that is determined by local assessors to be the total taxable value of land and additions on the property. | Land | Improvement |
|---|---|---|---|---|
| 2025 | $14,904 | $138,600 | $33,120 | $105,480 |
| 2024 | $14,904 | $121,070 | $14,710 | $106,360 |
| 2023 | $5,708 | $121,070 | $14,710 | $106,360 |
| 2022 | $5,317 | $112,420 | $14,710 | $97,710 |
| 2021 | $4,573 | $82,340 | $14,010 | $68,330 |
| 2020 | $4,623 | $82,340 | $14,010 | $68,330 |
| 2019 | $4,652 | $82,340 | $14,010 | $68,330 |
| 2018 | $4,423 | $69,980 | $14,010 | $55,970 |
| 2017 | $4,429 | $68,230 | $12,540 | $55,690 |
| 2016 | $4,407 | $68,230 | $12,540 | $55,690 |
| 2015 | $4,203 | $61,540 | $10,450 | $51,090 |
| 2014 | $4,153 | $61,540 | $10,450 | $51,090 |
| 2013 | $4,153 | $61,540 | $10,450 | $51,090 |
Source: Public Records
Map
Nearby Homes
- 143 Cinnamon Teal St
- 213 Painter St
- 216 Painter St
- 139 Gold Finch St
- 116 Gold Finch St
- 108 Gold Finch St
- 217 Warbler Ct
- 566 Preston Trails Dr
- 10164 Busey Rd NW
- 5436 Arrow Ct
- 223 Antrim St
- 7516 Hemrich Dr
- 7502 Canal Highlands Blvd
- 240 Fox Glen Dr E
- 657 Raab St
- 7474 Canal Highlands Blvd
- 7258 Lehman Park Place
- 7263 Lehman Park Place
- 7463 Canal Highlands Blvd
- 7436 Bullseye Dr
- 266 Linden Cir
- 274 Linden Cir
- 203 Fox Glen Dr W
- 262 Linden Cir
- 207 Fox Glen Dr W
- 199 Fox Glen Dr W
- 233 Beechnut St
- 278 Linden Cir
- 211 Fox Glen Dr W
- 258 Linden Cir
- 195 Fox Glen Dr W
- 217 Fox Glen Dr W
- 232 Beechnut St
- 237 Beechnut St
- 215 Fox Glen Dr W
- 261 Linden Cir
- 213 Fox Glen Dr W
- 282 Linden Cir
- 254 Linden Cir
- 236 Beechnut St
Your Personal Tour Guide
Ask me questions while you tour the home.