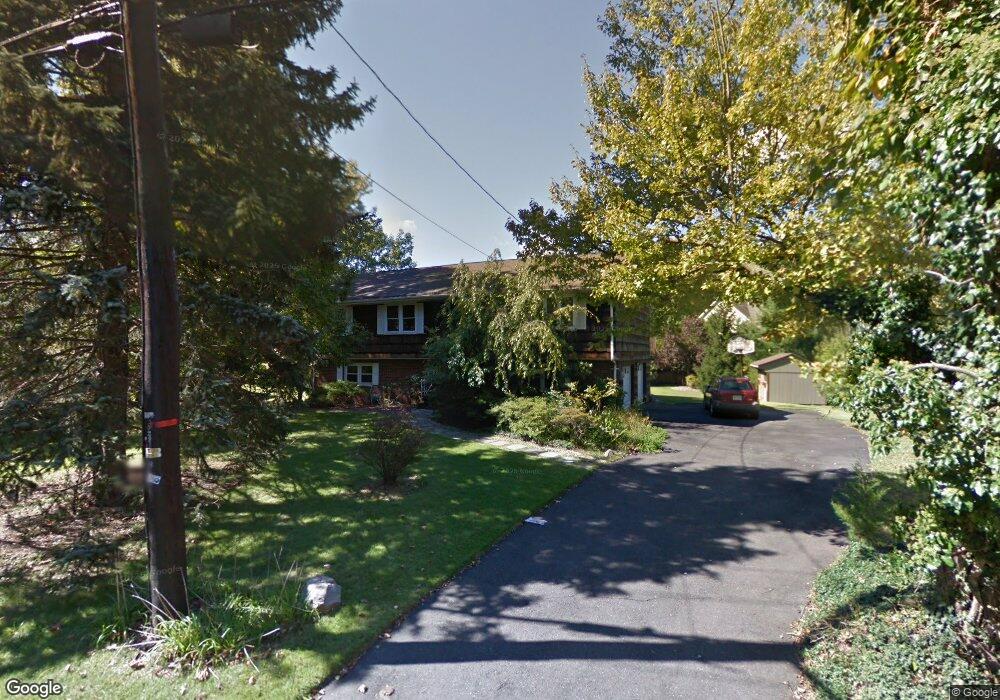
270 Lynn St Harrington Park, NJ 07640
Estimated Value: $940,000 - $1,091,000
4
Beds
3
Baths
2,843
Sq Ft
$350/Sq Ft
Est. Value
About This Home
This home is located at 270 Lynn St, Harrington Park, NJ 07640 and is currently estimated at $996,176, approximately $350 per square foot. 270 Lynn St is a home located in Bergen County with nearby schools including Harrington Park Elementary School, Northern Valley Regional High School at Old Tappan, and Acton Academy of Bergen County.
Ownership History
Date
Name
Owned For
Owner Type
Purchase Details
Closed on
Mar 30, 2020
Sold by
Rhee Jong Ho
Bought by
Jeong Taehum and Jeong Grace S
Current Estimated Value
Home Financials for this Owner
Home Financials are based on the most recent Mortgage that was taken out on this home.
Original Mortgage
$510,000
Interest Rate
3.1%
Mortgage Type
New Conventional
Purchase Details
Closed on
Sep 20, 2019
Sold by
Principe Heifi Est
Bought by
Rhee Jong H
Create a Home Valuation Report for This Property
The Home Valuation Report is an in-depth analysis detailing your home's value as well as a comparison with similar homes in the area
Home Values in the Area
Average Home Value in this Area
Purchase History
| Date | Buyer | Sale Price | Title Company |
|---|---|---|---|
| Jeong Taehum | $665,000 | Old Republic Natl Ttl Ins Co | |
| Rhee Jong H | $436,000 | American Land Title Affiliat |
Source: Public Records
Mortgage History
| Date | Status | Borrower | Loan Amount |
|---|---|---|---|
| Previous Owner | Jeong Taehum | $510,000 |
Source: Public Records
Tax History Compared to Growth
Tax History
| Year | Tax Paid | Tax Assessment Tax Assessment Total Assessment is a certain percentage of the fair market value that is determined by local assessors to be the total taxable value of land and additions on the property. | Land | Improvement |
|---|---|---|---|---|
| 2025 | $15,153 | $484,600 | $283,700 | $200,900 |
| 2024 | $14,688 | $484,600 | $283,700 | $200,900 |
| 2023 | $14,446 | $484,600 | $283,700 | $200,900 |
| 2022 | $14,446 | $484,600 | $283,700 | $200,900 |
| 2021 | $14,344 | $484,600 | $283,700 | $200,900 |
| 2020 | $14,281 | $484,600 | $283,700 | $200,900 |
| 2019 | $13,981 | $484,600 | $283,700 | $200,900 |
| 2018 | $13,724 | $484,600 | $283,700 | $200,900 |
| 2017 | $13,578 | $484,600 | $283,700 | $200,900 |
| 2016 | $13,191 | $484,600 | $283,700 | $200,900 |
| 2015 | $12,861 | $484,600 | $283,700 | $200,900 |
| 2014 | $12,566 | $484,600 | $283,700 | $200,900 |
Source: Public Records
Map
Nearby Homes