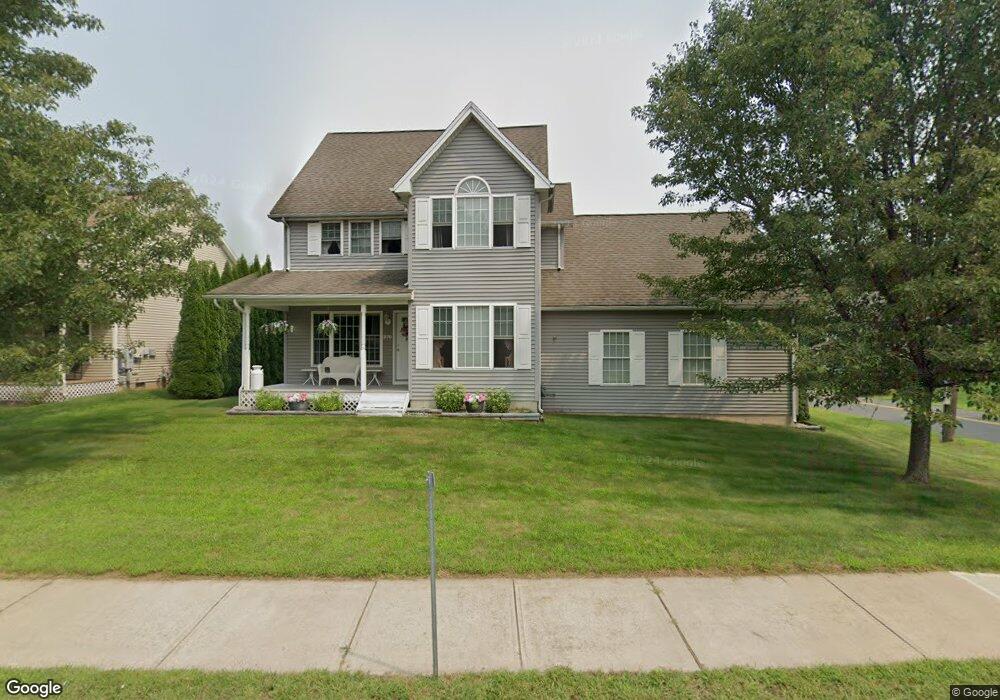
270 Main St Cromwell, CT 06416
Estimated Value: $412,000 - $451,000
3
Beds
3
Baths
1,717
Sq Ft
$254/Sq Ft
Est. Value
About This Home
This home is located at 270 Main St, Cromwell, CT 06416 and is currently estimated at $436,147, approximately $254 per square foot. 270 Main St is a home located in Middlesex County with nearby schools including Edna C. Stevens School, Woodside Intermediate School, and Cromwell Middle School.
Ownership History
Date
Name
Owned For
Owner Type
Purchase Details
Closed on
Jun 8, 2006
Sold by
Keith Andrew J
Bought by
Mcdonald Joann and Mcdonald Keith Andrew
Current Estimated Value
Purchase Details
Closed on
Apr 12, 2005
Sold by
Lydia V Cannata T V and Lydia Cannata
Bought by
Keith Andrew J
Home Financials for this Owner
Home Financials are based on the most recent Mortgage that was taken out on this home.
Original Mortgage
$237,510
Interest Rate
5.7%
Mortgage Type
Purchase Money Mortgage
Create a Home Valuation Report for This Property
The Home Valuation Report is an in-depth analysis detailing your home's value as well as a comparison with similar homes in the area
Home Values in the Area
Average Home Value in this Area
Purchase History
| Date | Buyer | Sale Price | Title Company |
|---|---|---|---|
| Mcdonald Joann | -- | -- | |
| Keith Andrew J | $263,900 | -- | |
| Mcdonald Joann | -- | -- | |
| Keith Andrew J | $263,900 | -- |
Source: Public Records
Mortgage History
| Date | Status | Borrower | Loan Amount |
|---|---|---|---|
| Previous Owner | Keith Andrew J | $237,510 | |
| Closed | Keith Andrew J | $0 |
Source: Public Records
Tax History
| Year | Tax Paid | Tax Assessment Tax Assessment Total Assessment is a certain percentage of the fair market value that is determined by local assessors to be the total taxable value of land and additions on the property. | Land | Improvement |
|---|---|---|---|---|
| 2025 | $6,992 | $227,080 | $60,130 | $166,950 |
| 2024 | $6,828 | $227,080 | $60,130 | $166,950 |
| 2023 | $6,678 | $227,080 | $60,130 | $166,950 |
| 2022 | $6,183 | $185,500 | $57,540 | $127,960 |
| 2021 | $6,183 | $185,500 | $57,540 | $127,960 |
| 2020 | $6,090 | $185,500 | $57,540 | $127,960 |
| 2019 | $6,090 | $185,500 | $57,540 | $127,960 |
| 2018 | $6,090 | $185,500 | $57,540 | $127,960 |
| 2017 | $5,472 | $161,260 | $49,990 | $111,270 |
| 2016 | $5,423 | $161,260 | $49,990 | $111,270 |
| 2015 | $5,060 | $161,260 | $49,990 | $111,270 |
| 2014 | $5,367 | $161,260 | $49,990 | $111,270 |
Source: Public Records
Map
Nearby Homes
Your Personal Tour Guide
Ask me questions while you tour the home.