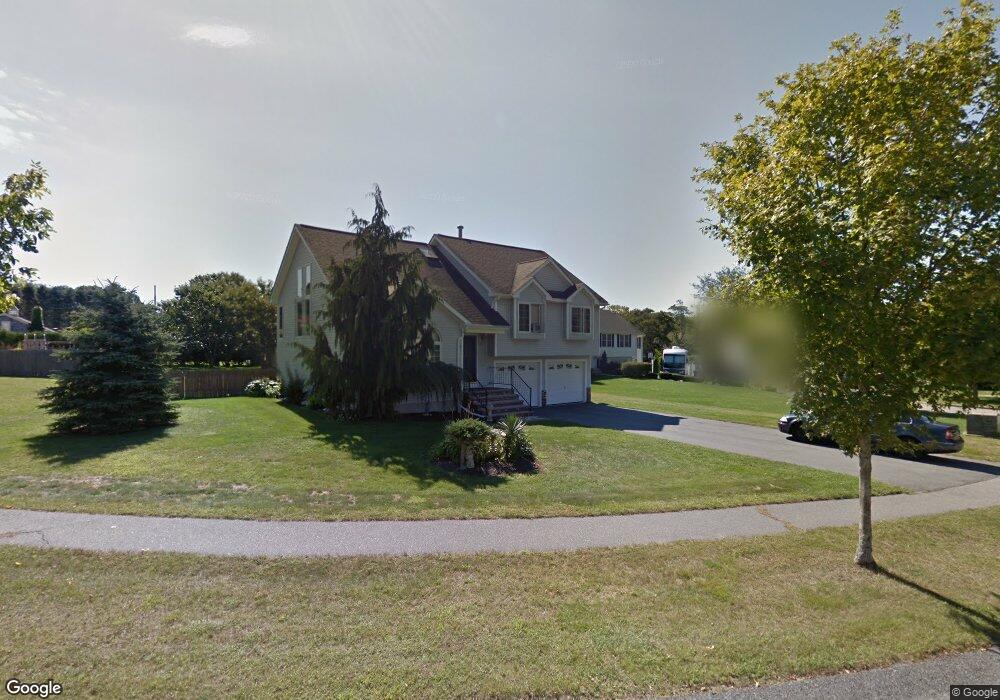
270 Moss St South Dartmouth, MA 02748
Bliss Corner NeighborhoodEstimated Value: $536,956 - $573,000
3
Beds
3
Baths
1,352
Sq Ft
$409/Sq Ft
Est. Value
About This Home
This home is located at 270 Moss St, South Dartmouth, MA 02748 and is currently estimated at $552,989, approximately $409 per square foot. 270 Moss St is a home located in Bristol County with nearby schools including Dartmouth High School, St. Teresa of Calcutta School, and Our Sister's School.
Ownership History
Date
Name
Owned For
Owner Type
Purchase Details
Closed on
Jan 14, 2025
Sold by
Jacintho Clarisse F and Jacintho Michael T
Bought by
270 Moss St Rt and Jacintho
Current Estimated Value
Purchase Details
Closed on
Jun 5, 2009
Sold by
Jacintho Clarisse F and Cabral Clarisse F
Bought by
Jacintho Clarisse F and Jacintho Michael T
Create a Home Valuation Report for This Property
The Home Valuation Report is an in-depth analysis detailing your home's value as well as a comparison with similar homes in the area
Home Values in the Area
Average Home Value in this Area
Purchase History
| Date | Buyer | Sale Price | Title Company |
|---|---|---|---|
| 270 Moss St Rt | -- | None Available | |
| Jacintho Clarisse F | -- | -- |
Source: Public Records
Mortgage History
| Date | Status | Borrower | Loan Amount |
|---|---|---|---|
| Previous Owner | Jacintho Clarisse F | $70,000 | |
| Previous Owner | Jacintho Clarisse F | $110,500 |
Source: Public Records
Tax History Compared to Growth
Tax History
| Year | Tax Paid | Tax Assessment Tax Assessment Total Assessment is a certain percentage of the fair market value that is determined by local assessors to be the total taxable value of land and additions on the property. | Land | Improvement |
|---|---|---|---|---|
| 2025 | $3,810 | $442,500 | $169,200 | $273,300 |
| 2024 | $3,734 | $429,700 | $169,200 | $260,500 |
| 2023 | $3,618 | $394,500 | $155,900 | $238,600 |
| 2022 | $3,472 | $350,700 | $155,900 | $194,800 |
| 2021 | $3,250 | $313,700 | $138,400 | $175,300 |
| 2020 | $3,236 | $311,800 | $144,900 | $166,900 |
| 2019 | $3,009 | $289,300 | $134,500 | $154,800 |
| 2018 | $3,036 | $292,900 | $134,500 | $158,400 |
| 2017 | $2,889 | $288,300 | $131,800 | $156,500 |
| 2016 | $3,071 | $302,300 | $144,000 | $158,300 |
| 2015 | $2,918 | $287,800 | $127,700 | $160,100 |
| 2014 | $2,863 | $280,400 | $124,200 | $156,200 |
Source: Public Records
Map
Nearby Homes
- 33 Rosewood Terrace
- 6 Walters Way
- 29 Elizabeth Ct
- 98 Mccabe St
- 25 Westwood Dr
- 6 Jacob Dr
- 32 Fulton St
- 0 Victoria St Unit 73457953
- 729 Allen St
- 49 Stackhouse St
- 212 Rockland St
- 48 Stephen St
- 1 Walter St
- 15 Puritan St
- 511 Bedford St
- 230 Frank St
- 38 Stowell St
- 5 Samosett Dr
- 3 Mishawum Dr
- 296 Hemlock St