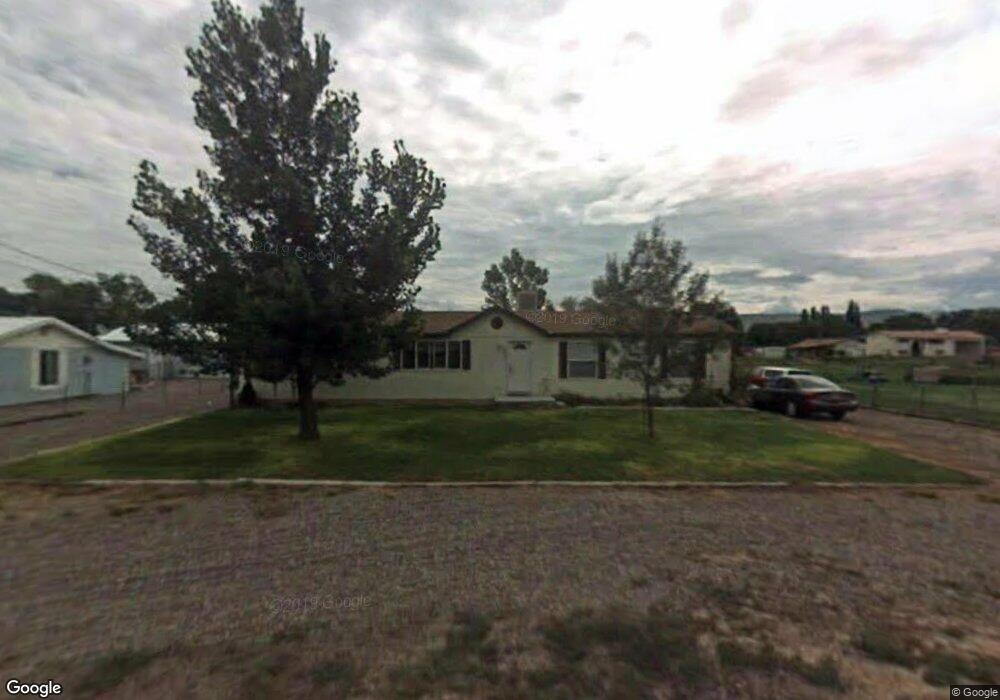
270 N 100 E Redmond, UT 84652
Estimated Value: $274,000 - $294,879
Studio
1
Bath
1,664
Sq Ft
$169/Sq Ft
Est. Value
About This Home
This home is located at 270 N 100 E, Redmond, UT 84652 and is currently estimated at $281,960, approximately $169 per square foot. 270 N 100 E is a home with nearby schools including Salina School, North Sevier Middle School, and North Sevier High School.
Ownership History
Date
Name
Owned For
Owner Type
Purchase Details
Closed on
Jan 6, 2026
Sold by
Bertelson Nathan R and Kunz Christina M
Bought by
Bertelson Kunz Living Trust and Bertelson
Current Estimated Value
Purchase Details
Closed on
Jul 25, 2025
Sold by
Kunz Joseph T
Bought by
Bertelson Nathan R and Kunz Christina M
Home Financials for this Owner
Home Financials are based on the most recent Mortgage that was taken out on this home.
Original Mortgage
$247,920
Interest Rate
6.84%
Mortgage Type
VA
Create a Home Valuation Report for This Property
The Home Valuation Report is an in-depth analysis detailing your home's value as well as a comparison with similar homes in the area
Purchase History
| Date | Buyer | Sale Price | Title Company |
|---|---|---|---|
| Bertelson Kunz Living Trust | -- | None Listed On Document | |
| Bertelson Nathan R | -- | First American Title | |
| Bertelson Nathan R | -- | First American Title |
Source: Public Records
Mortgage History
| Date | Status | Borrower | Loan Amount |
|---|---|---|---|
| Previous Owner | Bertelson Nathan R | $247,920 |
Source: Public Records
Tax History
| Year | Tax Paid | Tax Assessment Tax Assessment Total Assessment is a certain percentage of the fair market value that is determined by local assessors to be the total taxable value of land and additions on the property. | Land | Improvement |
|---|---|---|---|---|
| 2025 | $1,153 | $136,304 | $26,070 | $110,234 |
| 2024 | $1,153 | $132,127 | $23,322 | $108,805 |
| 2023 | $1,141 | $133,799 | $23,465 | $110,334 |
| 2022 | $1,400 | $141,522 | $24,385 | $117,137 |
| 2021 | $1,282 | $107,219 | $13,750 | $93,469 |
| 2020 | $1,033 | $81,010 | $13,750 | $67,260 |
| 2019 | $942 | $78,830 | $13,750 | $65,080 |
| 2018 | $0 | $58,360 | $12,380 | $45,980 |
| 2017 | $777 | $55,030 | $12,380 | $42,650 |
| 2016 | $763 | $55,030 | $0 | $0 |
| 2015 | $763 | $55,030 | $0 | $0 |
| 2014 | $763 | $58,300 | $0 | $0 |
Source: Public Records
Map
Nearby Homes
Your Personal Tour Guide
Ask me questions while you tour the home.