Estimated Value: $248,000 - $301,096
4
Beds
2
Baths
1,417
Sq Ft
$200/Sq Ft
Est. Value
About This Home
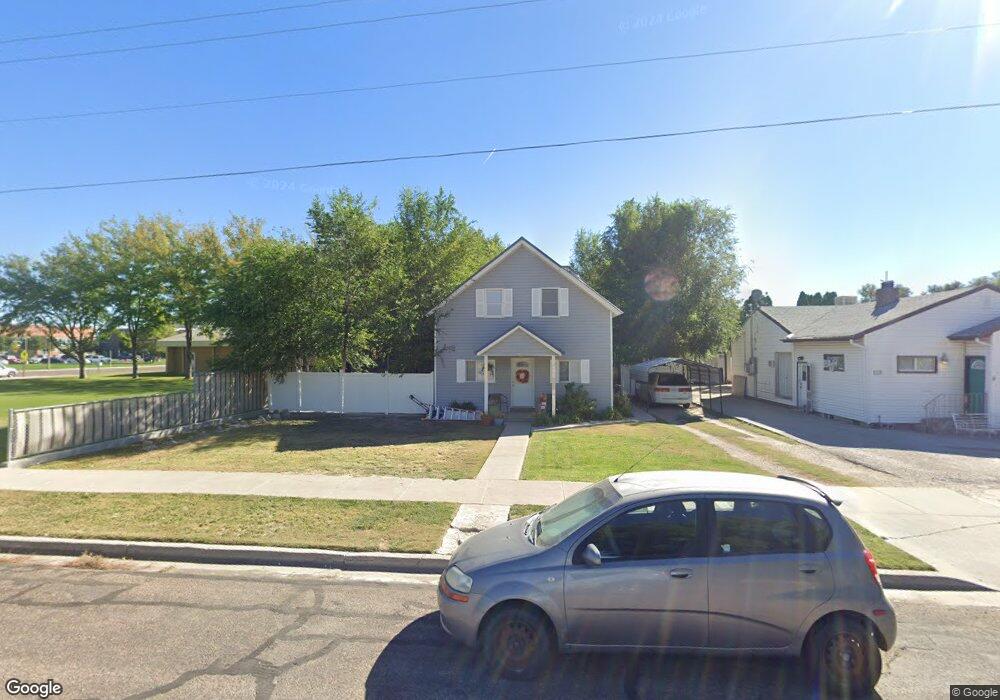
This home is located at 270 N 100 W, Delta, UT 84624 and is currently estimated at $283,524, approximately $200 per square foot. 270 N 100 W is a home located in Millard County with nearby schools including Cba Center and White River Academy.
Ownership History
Date
Name
Owned For
Owner Type
Purchase Details
Closed on
Mar 8, 2018
Sold by
Bettis Michael and Bettis Rachel
Bought by
Jones Daniel A
Current Estimated Value
Home Financials for this Owner
Home Financials are based on the most recent Mortgage that was taken out on this home.
Original Mortgage
$82,968
Outstanding Balance
$71,493
Interest Rate
4.8%
Mortgage Type
FHA
Estimated Equity
$212,031
Purchase Details
Closed on
Oct 31, 2011
Sold by
Lee Gbrimsley Roger
Bought by
Bettis Michael and Bettis Rachel
Home Financials for this Owner
Home Financials are based on the most recent Mortgage that was taken out on this home.
Original Mortgage
$66,276
Interest Rate
4.25%
Mortgage Type
FHA
Create a Home Valuation Report for This Property
The Home Valuation Report is an in-depth analysis detailing your home's value as well as a comparison with similar homes in the area
Home Values in the Area
Average Home Value in this Area
Purchase History
| Date | Buyer | Sale Price | Title Company |
|---|---|---|---|
| Jones Daniel A | -- | -- | |
| Bettis Michael | -- | -- |
Source: Public Records
Mortgage History
| Date | Status | Borrower | Loan Amount |
|---|---|---|---|
| Open | Jones Daniel A | $82,968 | |
| Previous Owner | Bettis Michael | $66,276 |
Source: Public Records
Tax History Compared to Growth
Tax History
| Year | Tax Paid | Tax Assessment Tax Assessment Total Assessment is a certain percentage of the fair market value that is determined by local assessors to be the total taxable value of land and additions on the property. | Land | Improvement |
|---|---|---|---|---|
| 2025 | $1,051 | $112,247 | $18,052 | $94,195 |
| 2024 | $1,051 | $90,057 | $13,006 | $77,051 |
| 2023 | $1,132 | $90,057 | $13,006 | $77,051 |
| 2022 | $905 | $68,038 | $13,598 | $54,440 |
| 2021 | $763 | $54,723 | $10,282 | $44,441 |
| 2020 | $709 | $50,547 | $9,347 | $41,200 |
| 2019 | $687 | $49,022 | $8,655 | $40,367 |
| 2018 | $624 | $44,871 | $8,655 | $36,216 |
| 2017 | $644 | $44,619 | $8,403 | $36,216 |
| 2016 | $623 | $44,619 | $8,403 | $36,216 |
| 2015 | $623 | $44,619 | $8,403 | $36,216 |
| 2014 | -- | $37,711 | $8,403 | $29,308 |
| 2013 | -- | $37,711 | $8,403 | $29,308 |
Source: Public Records
Map
Nearby Homes