Estimated Value: $126,178 - $206,000
3
Beds
1
Bath
1,648
Sq Ft
$101/Sq Ft
Est. Value
About This Home
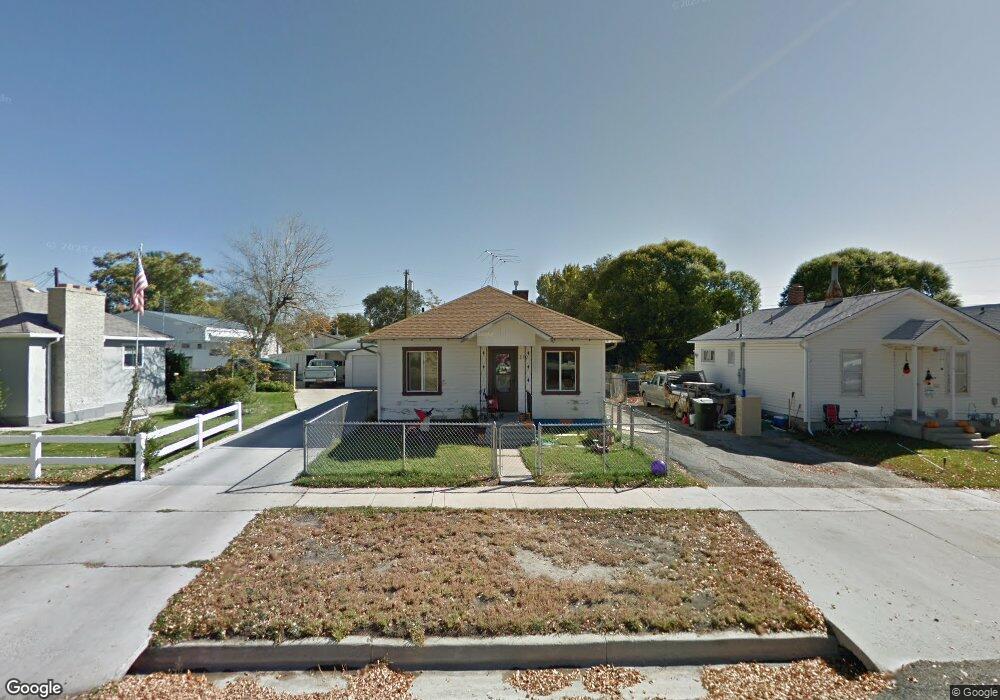
This home is located at 270 N 300 E, Price, UT 84501 and is currently estimated at $166,089, approximately $100 per square foot. 270 N 300 E is a home located in Carbon County with nearby schools including Castle Heights School, Mont Harmon Junior High School, and Carbon High School.
Ownership History
Date
Name
Owned For
Owner Type
Purchase Details
Closed on
Aug 30, 2022
Sold by
Cheyenne Colcord-London
Bought by
Cv Investment Properties Llc
Current Estimated Value
Purchase Details
Closed on
Aug 2, 2018
Sold by
Ajb Holdings Llc
Bought by
Colcord London Cheyenne and Colcord London Shaylie
Home Financials for this Owner
Home Financials are based on the most recent Mortgage that was taken out on this home.
Original Mortgage
$75,757
Interest Rate
4.5%
Mortgage Type
New Conventional
Create a Home Valuation Report for This Property
The Home Valuation Report is an in-depth analysis detailing your home's value as well as a comparison with similar homes in the area
Purchase History
| Date | Buyer | Sale Price | Title Company |
|---|---|---|---|
| Cv Investment Properties Llc | -- | South Eastern Utah Title | |
| Colcord London Cheyenne | -- | South Eastern Utah Title Com |
Source: Public Records
Mortgage History
| Date | Status | Borrower | Loan Amount |
|---|---|---|---|
| Previous Owner | Colcord London Cheyenne | $75,757 |
Source: Public Records
Tax History
| Year | Tax Paid | Tax Assessment Tax Assessment Total Assessment is a certain percentage of the fair market value that is determined by local assessors to be the total taxable value of land and additions on the property. | Land | Improvement |
|---|---|---|---|---|
| 2025 | $667 | $99,784 | $13,635 | $86,149 |
| 2024 | $924 | $139,946 | $16,500 | $123,446 |
| 2023 | $921 | $148,642 | $21,614 | $127,028 |
| 2022 | $955 | $76,104 | $9,884 | $66,221 |
| 2021 | $828 | $102,348 | $15,101 | $87,247 |
| 2020 | $814 | $50,523 | $0 | $0 |
| 2019 | $728 | $47,355 | $0 | $0 |
| 2018 | $753 | $49,993 | $0 | $0 |
| 2017 | $744 | $49,993 | $0 | $0 |
| 2016 | $671 | $49,993 | $0 | $0 |
| 2015 | $671 | $49,993 | $0 | $0 |
| 2014 | $667 | $49,993 | $0 | $0 |
| 2013 | $489 | $36,341 | $0 | $0 |
Source: Public Records
Map
Nearby Homes
Your Personal Tour Guide
Ask me questions while you tour the home.