Estimated Value: $658,539 - $778,000
3
Beds
3
Baths
3,469
Sq Ft
$207/Sq Ft
Est. Value
About This Home
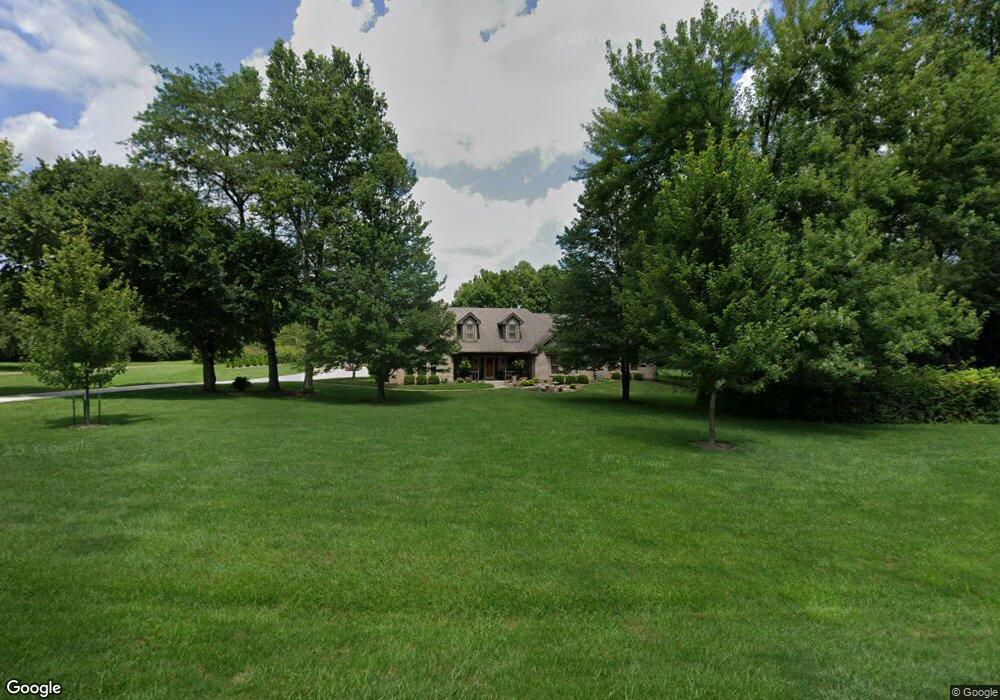
This home is located at 270 Narrows Trace, Xenia, OH 45385 and is currently estimated at $718,135, approximately $207 per square foot. 270 Narrows Trace is a home located in Greene County with nearby schools including Fairbrook Elementary School, Herman K Ankeney Middle School, and Beavercreek High School.
Ownership History
Date
Name
Owned For
Owner Type
Purchase Details
Closed on
May 31, 2016
Sold by
Bek Cheryl Ann and Bek David John
Bought by
Swann Billy J and Swann Pamela D
Current Estimated Value
Home Financials for this Owner
Home Financials are based on the most recent Mortgage that was taken out on this home.
Original Mortgage
$300,000
Outstanding Balance
$187,608
Interest Rate
3.61%
Mortgage Type
New Conventional
Estimated Equity
$530,527
Purchase Details
Closed on
May 29, 2009
Sold by
Bradshaw Michael and Bradshaw Vicki
Bought by
Swann Pamela D and Swann Billy J
Home Financials for this Owner
Home Financials are based on the most recent Mortgage that was taken out on this home.
Original Mortgage
$315,000
Interest Rate
4.94%
Mortgage Type
Unknown
Create a Home Valuation Report for This Property
The Home Valuation Report is an in-depth analysis detailing your home's value as well as a comparison with similar homes in the area
Home Values in the Area
Average Home Value in this Area
Purchase History
| Date | Buyer | Sale Price | Title Company |
|---|---|---|---|
| Swann Billy J | $375,000 | Attorney | |
| Swann Pamela D | $365,000 | Attorney |
Source: Public Records
Mortgage History
| Date | Status | Borrower | Loan Amount |
|---|---|---|---|
| Open | Swann Billy J | $300,000 | |
| Previous Owner | Swann Pamela D | $315,000 |
Source: Public Records
Tax History Compared to Growth
Tax History
| Year | Tax Paid | Tax Assessment Tax Assessment Total Assessment is a certain percentage of the fair market value that is determined by local assessors to be the total taxable value of land and additions on the property. | Land | Improvement |
|---|---|---|---|---|
| 2024 | $10,867 | $192,970 | $31,580 | $161,390 |
| 2023 | $10,867 | $192,970 | $31,580 | $161,390 |
| 2022 | $9,652 | $150,210 | $26,320 | $123,890 |
| 2021 | $9,414 | $145,160 | $26,320 | $118,840 |
| 2020 | $9,459 | $145,160 | $26,320 | $118,840 |
| 2019 | $9,798 | $138,060 | $26,320 | $111,740 |
| 2018 | $8,541 | $138,060 | $26,320 | $111,740 |
| 2017 | $8,246 | $138,060 | $26,320 | $111,740 |
| 2016 | $8,132 | $129,700 | $26,320 | $103,380 |
| 2015 | $4,091 | $129,700 | $26,320 | $103,380 |
| 2014 | $7,992 | $129,700 | $26,320 | $103,380 |
Source: Public Records
Map
Nearby Homes
- 264 S Alpha Bellbrook Rd
- 3109 Indian Ripple Rd
- 131 Ridgebrook Trail
- 3211 Tarleton Dr
- 179 Honey Jane Dr
- 122 Parkhurst Rd
- 679 S Alpha Bellbrook Rd
- 197 Bramblebush Trail
- 185 Bramblebush Trail
- 281 Locust Ct
- 153 George Wythe Way
- 3597 Echo Hill Ln
- 91 Cherry Hill Dr
- 463 Valhalla Ct
- 2580 Paydon Randoff Rd
- 3132 Casler Ave
- 295 Stratford Ln
- 2940 Stonewall Dr
- 3985 Shagbark Ln
- Cheswicke Plan at Sky Crossing
- 258 Narrows Trace
- 233 S Alpha Bellbrook Rd
- 220 S Alpha Bellbrook Rd
- 293 Cedar Trace
- 282 Narrows Trace
- 3160 Sonnyann Place
- 206 S Alpha Bellbrook Rd
- 300 Cedar Trace
- 261 S Alpha Bellbrook Rd
- 263 S Alpha Bellbrook Rd
- 207 S Alpha Bellbrook Rd
- 288 Narrows Trace
- 253 S Alpha Bellbrook Rd
- 0 Cedar Trace
- 3174 Sonnyann Place
- 291 Narrows Trace
- 320 Cedar Trace
- 187 S Alpha Bellbrook Rd
- 3161 Sonnyann Place
- 182 S Alpha Bellbrook Rd