Estimated Value: $439,470 - $703,000
3
Beds
3
Baths
2,072
Sq Ft
$293/Sq Ft
Est. Value
About This Home
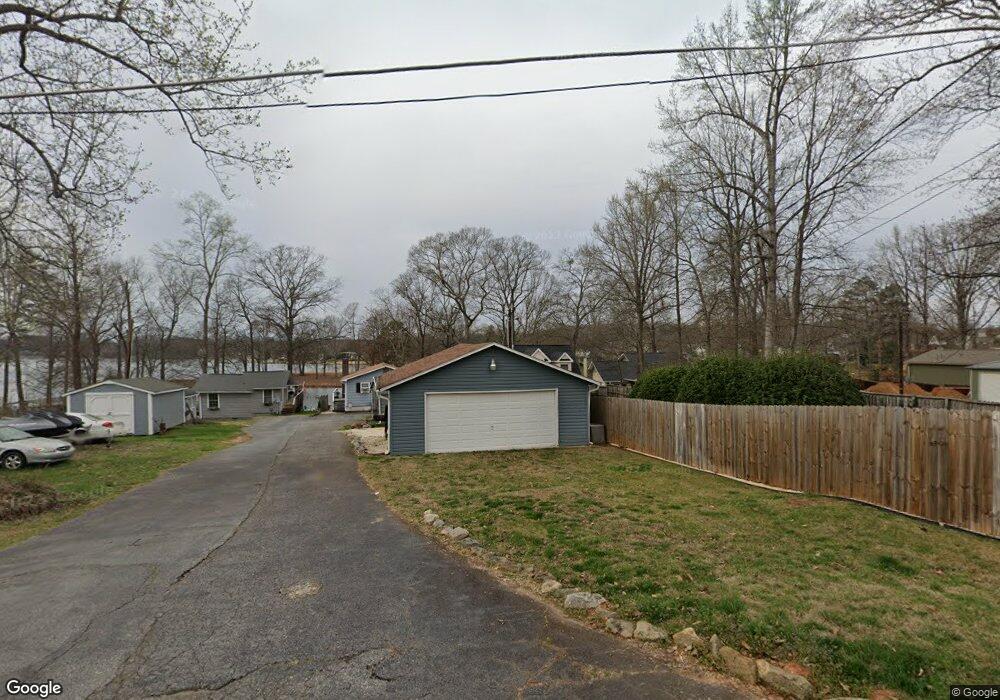
This home is located at 270 Oliver Dr, Inman, SC 29349 and is currently estimated at $607,868, approximately $293 per square foot. 270 Oliver Dr is a home located in Spartanburg County with nearby schools including New Prospect Elementary School, T.E. Mabry Middle School, and Chapman High School.
Ownership History
Date
Name
Owned For
Owner Type
Purchase Details
Closed on
May 14, 2020
Sold by
Boville Erin Llc
Bought by
Sullivan Kevin F and Sullivan Jo Anne
Current Estimated Value
Purchase Details
Closed on
Mar 6, 2019
Sold by
Sullivan Kevin F and Sullivan Jo Anne Y
Bought by
Boville Erin Llc
Purchase Details
Closed on
May 29, 2018
Sold by
Flowe Douglas A and Flowe Bonnie B
Bought by
Sullivan Kevin F and Sullivan Jo Anne Y
Home Financials for this Owner
Home Financials are based on the most recent Mortgage that was taken out on this home.
Original Mortgage
$277,125
Interest Rate
4.4%
Mortgage Type
New Conventional
Purchase Details
Closed on
Oct 6, 2006
Sold by
Benedict Pamela T
Bought by
Flowe Douglas A and Flowe Bonnie B
Purchase Details
Closed on
Sep 30, 1999
Sold by
Gibbs James A and Gibbs Sharon I
Bought by
Benedict Pamela T
Create a Home Valuation Report for This Property
The Home Valuation Report is an in-depth analysis detailing your home's value as well as a comparison with similar homes in the area
Home Values in the Area
Average Home Value in this Area
Purchase History
| Date | Buyer | Sale Price | Title Company |
|---|---|---|---|
| Sullivan Kevin F | -- | None Available | |
| Boville Erin Llc | -- | None Available | |
| Sullivan Kevin F | $369,500 | None Available | |
| Flowe Douglas A | $320,000 | None Available | |
| Benedict Pamela T | $157,000 | -- |
Source: Public Records
Mortgage History
| Date | Status | Borrower | Loan Amount |
|---|---|---|---|
| Previous Owner | Sullivan Kevin F | $277,125 |
Source: Public Records
Tax History Compared to Growth
Tax History
| Year | Tax Paid | Tax Assessment Tax Assessment Total Assessment is a certain percentage of the fair market value that is determined by local assessors to be the total taxable value of land and additions on the property. | Land | Improvement |
|---|---|---|---|---|
| 2025 | $9,504 | $24,900 | $6,708 | $18,192 |
| 2024 | $9,504 | $24,900 | $6,708 | $18,192 |
| 2023 | $9,504 | $24,900 | $6,708 | $18,192 |
| 2022 | $9,896 | $24,384 | $7,746 | $16,638 |
| 2021 | $9,896 | $24,384 | $7,746 | $16,638 |
| 2020 | $9,841 | $24,384 | $7,746 | $16,638 |
| 2019 | $8,954 | $11,269 | $3,146 | $8,123 |
| 2018 | $4,580 | $11,269 | $3,146 | $8,123 |
| 2017 | $3,960 | $9,800 | $3,477 | $6,323 |
| 2016 | $3,960 | $9,800 | $3,477 | $6,323 |
| 2015 | $3,955 | $9,801 | $3,477 | $6,324 |
| 2014 | $3,949 | $9,801 | $3,477 | $6,324 |
Source: Public Records
Map
Nearby Homes
- 197 Oliver Dr
- 191 Oliver Dr
- 187 Oliver Dr
- 104 Coastline Dr
- 0 Fraley Dr
- 26 Coastline Dr
- 418 Rockcove Rd
- 6005 Highway 11
- 8551 Highway 9
- 196 Crow Rd
- 241 Coggins Shore Rd
- 216 E Caledonia Ct
- 383 Island Green Ln
- 1255 Stoneleigh Rd
- 434 Tangleridge Dr
- 516 Camrose Ct
- 1310 Kildary Springs Rd
- 1320 Kildary Springs Rd
- 1330 Kildary Springs Rd
- Quincy Plan at New Prospect Haven
- 266 Oliver Dr
- 252 Oliver Dr
- 276 Oliver Dr
- 282 Oliver Dr
- 275 Oliver Dr
- 271 Oliver Dr
- 240 Oliver Dr
- 277 Oliver Dr
- 302 Oliver Dr
- 247 Oliver Dr
- 238 Oliver Dr
- 312 Oliver Dr
- 315 Oliver Dr
- 318 Oliver Dr
- 0 Oliver Dr Unit 184310
- 0 Oliver Dr Unit 195060
- 0 Oliver Dr Unit 1158718
- 0 Oliver Dr Unit 1194674
- 0 Oliver Dr Unit 1197838
- 0 Oliver Dr Unit 1222946