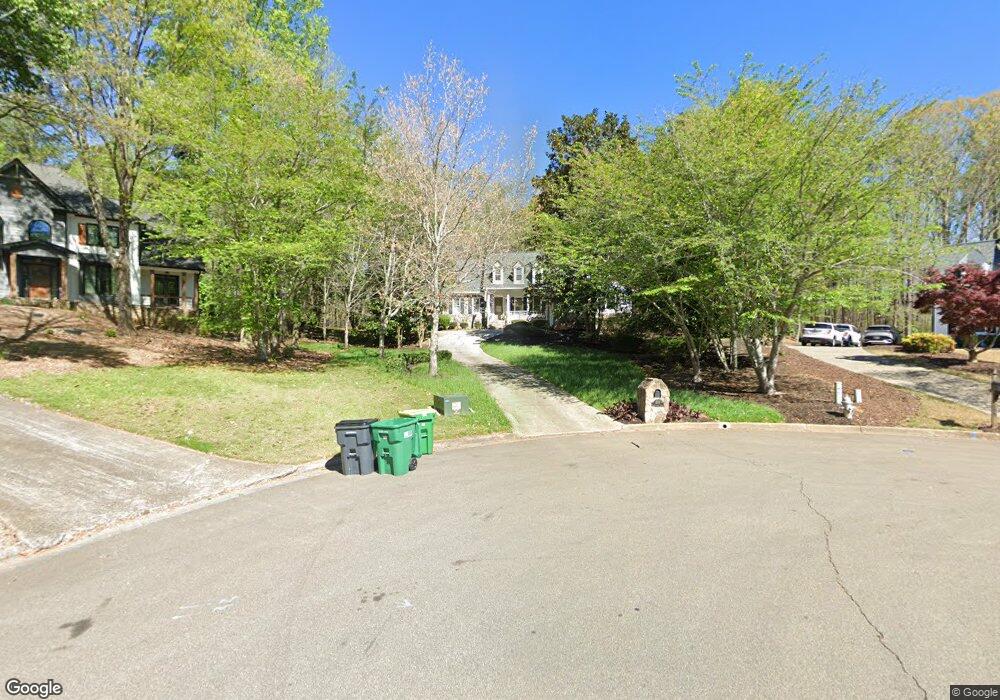
270 Plantation Cove Alpharetta, GA 30004
Estimated Value: $648,000 - $877,000
3
Beds
3
Baths
2,444
Sq Ft
$316/Sq Ft
Est. Value
About This Home
This home is located at 270 Plantation Cove, Alpharetta, GA 30004 and is currently estimated at $773,413, approximately $316 per square foot. 270 Plantation Cove is a home located in Fulton County with nearby schools including Summit Hill Elementary School, Hopewell Middle School, and Cambridge High School.
Ownership History
Date
Name
Owned For
Owner Type
Purchase Details
Closed on
Apr 25, 2007
Sold by
Ruffley Alyce J
Bought by
Hughes Michael and Onians Julia
Current Estimated Value
Home Financials for this Owner
Home Financials are based on the most recent Mortgage that was taken out on this home.
Original Mortgage
$261,200
Outstanding Balance
$165,177
Interest Rate
7%
Mortgage Type
New Conventional
Estimated Equity
$608,236
Purchase Details
Closed on
Jun 14, 2005
Sold by
Waters Amy S
Bought by
Ruffley Alyce J
Home Financials for this Owner
Home Financials are based on the most recent Mortgage that was taken out on this home.
Original Mortgage
$175,000
Interest Rate
5.69%
Mortgage Type
New Conventional
Purchase Details
Closed on
Aug 9, 2002
Sold by
Jacob George R and Jacob Mary Ann
Bought by
Waters Amy S
Home Financials for this Owner
Home Financials are based on the most recent Mortgage that was taken out on this home.
Original Mortgage
$215,016
Interest Rate
6.1%
Mortgage Type
New Conventional
Create a Home Valuation Report for This Property
The Home Valuation Report is an in-depth analysis detailing your home's value as well as a comparison with similar homes in the area
Home Values in the Area
Average Home Value in this Area
Purchase History
| Date | Buyer | Sale Price | Title Company |
|---|---|---|---|
| Hughes Michael | $326,500 | -- | |
| Ruffley Alyce J | $316,000 | -- | |
| Waters Amy S | $268,000 | -- |
Source: Public Records
Mortgage History
| Date | Status | Borrower | Loan Amount |
|---|---|---|---|
| Open | Hughes Michael | $261,200 | |
| Previous Owner | Ruffley Alyce J | $175,000 | |
| Previous Owner | Waters Amy S | $215,016 |
Source: Public Records
Tax History Compared to Growth
Tax History
| Year | Tax Paid | Tax Assessment Tax Assessment Total Assessment is a certain percentage of the fair market value that is determined by local assessors to be the total taxable value of land and additions on the property. | Land | Improvement |
|---|---|---|---|---|
| 2025 | $680 | $272,120 | $95,880 | $176,240 |
| 2023 | $4,839 | $171,440 | $47,120 | $124,320 |
| 2022 | $2,364 | $171,440 | $47,120 | $124,320 |
| 2021 | $2,337 | $152,480 | $42,360 | $110,120 |
| 2020 | $2,334 | $150,680 | $41,880 | $108,800 |
| 2019 | $672 | $148,000 | $41,120 | $106,880 |
| 2018 | $2,394 | $144,520 | $40,160 | $104,360 |
| 2017 | $2,282 | $133,040 | $29,400 | $103,640 |
| 2016 | $2,274 | $133,040 | $29,400 | $103,640 |
| 2015 | $2,841 | $133,040 | $29,400 | $103,640 |
| 2014 | $2,290 | $133,040 | $29,400 | $103,640 |
Source: Public Records
Map
Nearby Homes
- 125 Crabapple Way
- 15794 S Thompson Rd
- 15792 S Thompson Rd
- 15785 S Thompson Rd
- 160 Stone Orchard Ct
- 3309 Hamby Rd
- 2060 Magnolia Ln Unit 8
- 16050 Thompson Rd
- 515 Watboro Hill Dr
- 615 Watboro Hill Dr
- 3630 Hamby Oaks Dr
- 2053 Magnolia Ln Unit 10
- 2050 Magnolia Ln
- 125 Hopewell Grove Dr
- 3510 Hamby Oaks Dr
- 585 Watboro Hill Dr
- 2030 Magnolia Ln
- 3027 Watsons Bend
- 3084 Watson's Bend
- 260 Plantation Cove
- 255 Plantation Cove
- 15840 Thompson Rd
- 250 Plantation Cove
- 245 Plantation Cove
- 15365 Little Stone Way
- 235 Plantation Cove Unit 1
- 230 Plantation Cove
- 240 Plantation Cove
- 15810 Thompson Rd
- 15355 Little Stone Way
- 3278 Hamby Rd
- 3278 Hamby Rd
- 15375 Little Stone Way Unit 2
- 15820 S Thompson Rd
- 15820 Thompson Rd
- 15860 S Thompson Rd
- 15800 Thompson Rd
- 15860 Thompson Rd