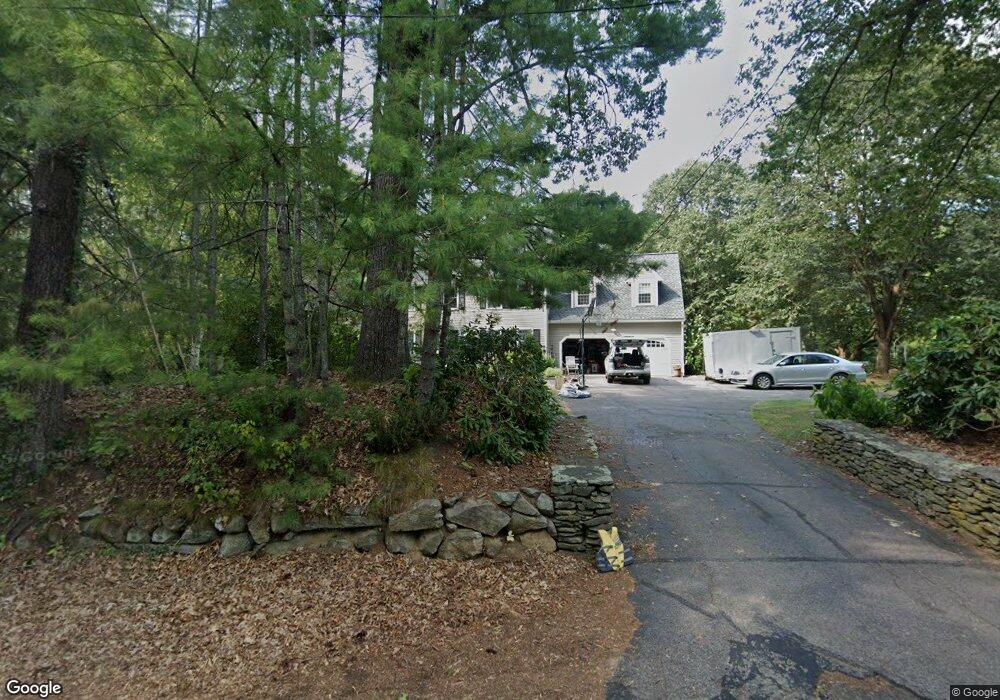
270 Pond St Hopkinton, MA 01748
Estimated Value: $1,108,047 - $1,145,000
4
Beds
3
Baths
3,252
Sq Ft
$348/Sq Ft
Est. Value
About This Home
This home is located at 270 Pond St, Hopkinton, MA 01748 and is currently estimated at $1,130,762, approximately $347 per square foot. 270 Pond St is a home located in Middlesex County with nearby schools including Elmwood Elementary School, Hopkins Elementary School, and Marathon Elementary School.
Ownership History
Date
Name
Owned For
Owner Type
Purchase Details
Closed on
Jun 11, 2009
Sold by
Harwood Alice M
Bought by
Scott Karlyn A and Scott Douglas L
Current Estimated Value
Purchase Details
Closed on
Sep 20, 2007
Sold by
Harwood Alice M
Bought by
Anderson Sherie and Anderson Stephen
Purchase Details
Closed on
Oct 31, 2003
Sold by
Pucci Deborah L and Pucci Steven J
Bought by
Relocation Resources I
Purchase Details
Closed on
Jul 12, 2001
Sold by
Kavanagh Kimberlee and Kavanagh K
Bought by
Pucci Steven J and Pucci Deborah L
Purchase Details
Closed on
Jan 7, 1992
Sold by
Tanella Dean
Bought by
Kavanagh James and Kavanagh Kimberlee
Purchase Details
Closed on
May 13, 1987
Sold by
Sullucia Realty Tr
Bought by
Tanella Dean G
Create a Home Valuation Report for This Property
The Home Valuation Report is an in-depth analysis detailing your home's value as well as a comparison with similar homes in the area
Home Values in the Area
Average Home Value in this Area
Purchase History
| Date | Buyer | Sale Price | Title Company |
|---|---|---|---|
| Scott Karlyn A | $527,000 | -- | |
| Scott Karlyn A | $527,000 | -- | |
| Anderson Sherie | -- | -- | |
| Anderson Sherie | -- | -- | |
| Relocation Resources I | $530,000 | -- | |
| Harwood Alice M | $530,000 | -- | |
| Relocation Resources I | $530,000 | -- | |
| Pucci Steven J | $525,000 | -- | |
| Kavanagh James | $310,000 | -- | |
| Tanella Dean G | $299,900 | -- |
Source: Public Records
Mortgage History
| Date | Status | Borrower | Loan Amount |
|---|---|---|---|
| Open | Tanella Dean G | $405,000 | |
| Closed | Tanella Dean G | $50,000 |
Source: Public Records
Tax History Compared to Growth
Tax History
| Year | Tax Paid | Tax Assessment Tax Assessment Total Assessment is a certain percentage of the fair market value that is determined by local assessors to be the total taxable value of land and additions on the property. | Land | Improvement |
|---|---|---|---|---|
| 2025 | $12,681 | $894,300 | $359,700 | $534,600 |
| 2024 | $12,502 | $855,700 | $342,400 | $513,300 |
| 2023 | $12,196 | $771,400 | $300,500 | $470,900 |
| 2022 | $11,947 | $701,500 | $273,200 | $428,300 |
| 2021 | $11,609 | $679,700 | $265,000 | $414,700 |
| 2020 | $11,069 | $658,100 | $258,900 | $399,200 |
| 2019 | $10,451 | $608,700 | $249,000 | $359,700 |
| 2018 | $9,912 | $586,500 | $237,300 | $349,200 |
| 2017 | $9,611 | $572,100 | $230,600 | $341,500 |
| 2016 | $9,126 | $535,900 | $226,100 | $309,800 |
| 2015 | $9,106 | $507,000 | $219,600 | $287,400 |
Source: Public Records
Map
Nearby Homes