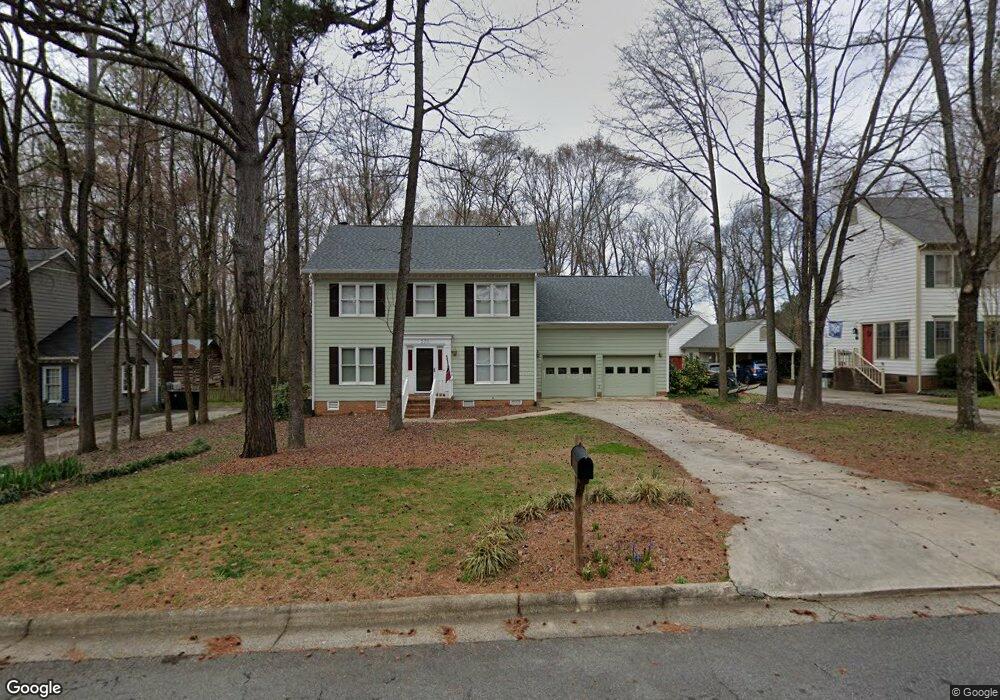
270 Post Oak Ave SW Concord, NC 28025
Estimated Value: $361,434 - $397,000
3
Beds
4
Baths
2,215
Sq Ft
$170/Sq Ft
Est. Value
About This Home
This home is located at 270 Post Oak Ave SW, Concord, NC 28025 and is currently estimated at $376,359, approximately $169 per square foot. 270 Post Oak Ave SW is a home located in Cabarrus County with nearby schools including R Brown Mcallister STEMElementary, Concord Middle School, and Concord High School.
Ownership History
Date
Name
Owned For
Owner Type
Purchase Details
Closed on
Nov 1, 2016
Sold by
Patterson James Keith
Bought by
Sandidge Rick W and Sandidge Keshia R
Current Estimated Value
Home Financials for this Owner
Home Financials are based on the most recent Mortgage that was taken out on this home.
Original Mortgage
$200,500
Outstanding Balance
$160,967
Interest Rate
3.42%
Mortgage Type
New Conventional
Estimated Equity
$215,392
Purchase Details
Closed on
Mar 31, 2015
Sold by
Jones Geoffrey Hale and Jones Lisa Hester
Bought by
Patterson James Keith and Patterson Rebecca
Home Financials for this Owner
Home Financials are based on the most recent Mortgage that was taken out on this home.
Original Mortgage
$189,555
Interest Rate
3.79%
Purchase Details
Closed on
Jul 1, 1987
Bought by
Jones Geoffrey Hale and Jones Lesa H
Create a Home Valuation Report for This Property
The Home Valuation Report is an in-depth analysis detailing your home's value as well as a comparison with similar homes in the area
Home Values in the Area
Average Home Value in this Area
Purchase History
| Date | Buyer | Sale Price | Title Company |
|---|---|---|---|
| Sandidge Rick W | $199,000 | None Available | |
| Patterson James Keith | $183,500 | None Available | |
| Jones Geoffrey Hale | $101,500 | -- |
Source: Public Records
Mortgage History
| Date | Status | Borrower | Loan Amount |
|---|---|---|---|
| Open | Sandidge Rick W | $200,500 | |
| Previous Owner | Patterson James Keith | $189,555 |
Source: Public Records
Tax History Compared to Growth
Tax History
| Year | Tax Paid | Tax Assessment Tax Assessment Total Assessment is a certain percentage of the fair market value that is determined by local assessors to be the total taxable value of land and additions on the property. | Land | Improvement |
|---|---|---|---|---|
| 2025 | $3,296 | $330,890 | $78,000 | $252,890 |
| 2024 | $3,296 | $330,890 | $78,000 | $252,890 |
| 2023 | $2,246 | $184,110 | $40,000 | $144,110 |
| 2022 | $2,246 | $184,110 | $40,000 | $144,110 |
| 2021 | $2,246 | $184,110 | $40,000 | $144,110 |
| 2020 | $2,246 | $184,110 | $40,000 | $144,110 |
| 2019 | $1,973 | $161,740 | $36,000 | $125,740 |
| 2018 | $1,941 | $161,740 | $36,000 | $125,740 |
| 2017 | $1,909 | $161,740 | $36,000 | $125,740 |
| 2016 | $1,132 | $156,100 | $36,000 | $120,100 |
| 2015 | $1,842 | $156,100 | $36,000 | $120,100 |
| 2014 | $1,842 | $156,100 | $36,000 | $120,100 |
Source: Public Records
Map
Nearby Homes
- 309 Brightwood Ct SW
- 269 Fryling Ave SW
- 671 Sedgefield St SW
- 159 Fryling Ave SW
- 358 Cozart Ave SW
- 111 Wilshire Ave SW
- 80 Pounds Ave SW
- 736 Spring St SW
- 782 Union St S
- 569 Union St S
- 571 Union St S
- 85 Myrtle Ave SW
- 355 Melrose Dr SW Unit B
- 355 Melrose Dr SW Unit A
- 355 Melrose Dr SW Unit F
- 336 Lincoln St SW
- 783 Union St S
- 229 Boger Ct SW
- 330 Malvern Dr SW Unit A
- 330 Malvern Dr SW Unit B
- 272 Post Oak Ave SW
- 268 Post Oak Ave SW
- 00 Post Oak Ave SW Unit 55
- 274 Post Oak Ave SW
- 266 Post Oak Ave SW
- 269 Post Oak Ave SW
- 267 Post Oak Ave SW
- 276 Post Oak Ave SW
- 264 Post Oak Ave SW
- 265 Post Oak Ave SW
- 271 Post Oak Ave SW
- 272 Lemon Tree Ln SW
- 270 Lemon Tree Ln SW
- 672 Journey St SW
- 278 Post Oak Ave SW
- 262 Post Oak Ave SW
- 268 Lemon Tree Ln SW
- 273 Post Oak Ave SW
- 266 Lemon Tree Ln SW
- 280 Post Oak Ave SW