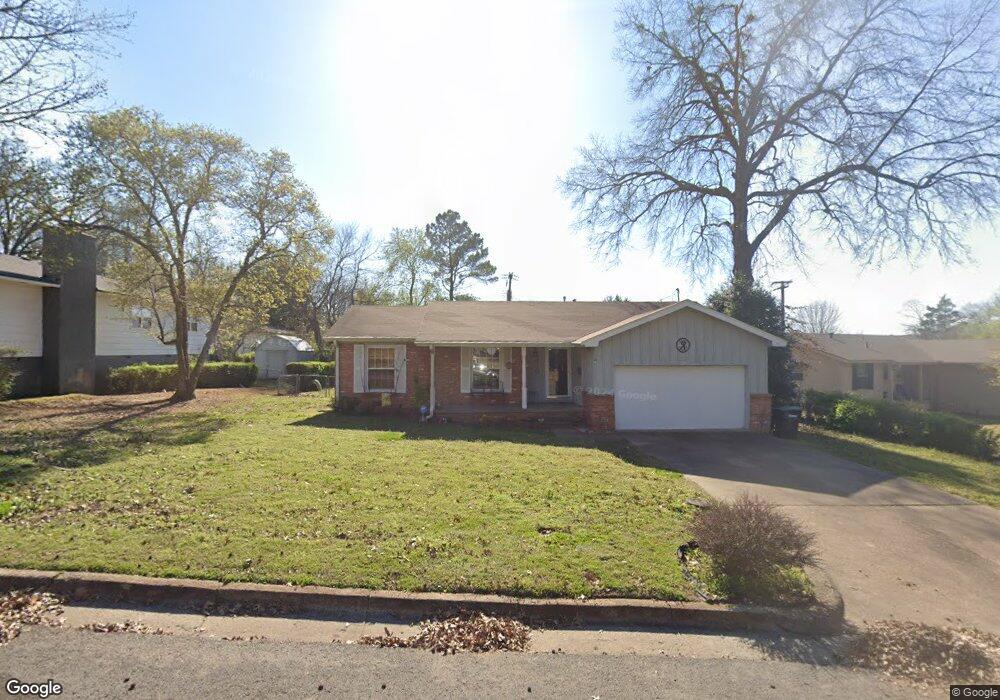
270 Redbud Ln Tahlequah, OK 74464
Estimated Value: $169,053 - $214,000
3
Beds
2
Baths
1,514
Sq Ft
$129/Sq Ft
Est. Value
About This Home
This home is located at 270 Redbud Ln, Tahlequah, OK 74464 and is currently estimated at $195,263, approximately $128 per square foot. 270 Redbud Ln is a home located in Cherokee County with nearby schools including Greenwood Elementary School, Cherokee Elementary School, and Tahlequah Middle School.
Ownership History
Date
Name
Owned For
Owner Type
Purchase Details
Closed on
Dec 19, 2018
Sold by
Davis Reeda J and Jones Jimmie Lee
Bought by
Jones Reeda J and Robinson Sonya J
Current Estimated Value
Home Financials for this Owner
Home Financials are based on the most recent Mortgage that was taken out on this home.
Original Mortgage
$85,300
Outstanding Balance
$54,032
Interest Rate
4.9%
Mortgage Type
New Conventional
Estimated Equity
$141,231
Purchase Details
Closed on
Jul 3, 2018
Sold by
Davis Reeda J and Robinson Reeda J
Bought by
Davis Reeda J and Robinson Sonya J
Purchase Details
Closed on
Jan 6, 2015
Sold by
Robinson Reeda J and Davis Reeda J
Bought by
Robinson Reeda J
Home Financials for this Owner
Home Financials are based on the most recent Mortgage that was taken out on this home.
Original Mortgage
$101,190
Interest Rate
3.25%
Mortgage Type
FHA
Create a Home Valuation Report for This Property
The Home Valuation Report is an in-depth analysis detailing your home's value as well as a comparison with similar homes in the area
Home Values in the Area
Average Home Value in this Area
Purchase History
| Date | Buyer | Sale Price | Title Company |
|---|---|---|---|
| Jones Reeda J | -- | None Available | |
| Davis Reeda J | -- | None Available | |
| Robinson Reeda J | -- | None Available |
Source: Public Records
Mortgage History
| Date | Status | Borrower | Loan Amount |
|---|---|---|---|
| Open | Jones Reeda J | $85,300 | |
| Closed | Robinson Reeda J | $101,190 |
Source: Public Records
Tax History Compared to Growth
Tax History
| Year | Tax Paid | Tax Assessment Tax Assessment Total Assessment is a certain percentage of the fair market value that is determined by local assessors to be the total taxable value of land and additions on the property. | Land | Improvement |
|---|---|---|---|---|
| 2025 | $735 | $8,868 | $703 | $8,165 |
| 2024 | $721 | $8,610 | $683 | $7,927 |
| 2023 | $721 | $8,358 | $636 | $7,722 |
| 2022 | $660 | $8,115 | $618 | $7,497 |
| 2021 | $641 | $7,879 | $600 | $7,279 |
| 2020 | $630 | $7,649 | $582 | $7,067 |
| 2019 | $604 | $7,427 | $566 | $6,861 |
| 2018 | $685 | $7,210 | $648 | $6,562 |
| 2017 | $652 | $6,867 | $617 | $6,250 |
| 2016 | $624 | $6,540 | $588 | $5,952 |
| 2015 | $558 | $6,229 | $611 | $5,618 |
| 2014 | $558 | $5,932 | $632 | $5,300 |
Source: Public Records
Map
Nearby Homes
- 413 Greenwood Dr
- 702 Wilson Ave
- 306 Short St
- 1105 S Maple Ave
- 201 Sandy Cir
- 757 S Bluff Ave
- 1290 E 4th St
- 508 Covington Place
- 720 S East Ave
- 605 S Oak Ave
- 802 S College Ave
- 403 S Bluff Ave
- 215 S Maple Ave
- 510 S Cherokee Ave
- 14351 U S Highway 62
- 16133 U S Highway 62
- 215 E Fuller St
- 835 Blue Heron
- 502 S Cedar Place
- 513 S State Ave