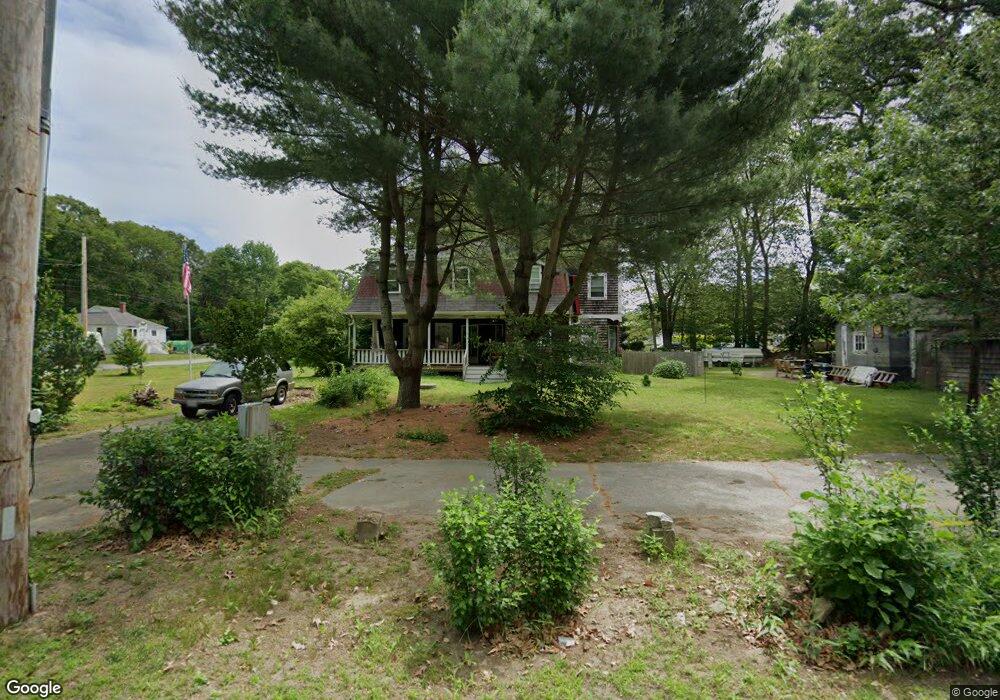
270 Sanford Rd Westport, MA 02790
North Westport NeighborhoodEstimated Value: $535,689 - $606,000
3
Beds
--
Bath
1,958
Sq Ft
$285/Sq Ft
Est. Value
About This Home
This home is located at 270 Sanford Rd, Westport, MA 02790 and is currently estimated at $557,172, approximately $284 per square foot. 270 Sanford Rd is a home located in Bristol County with nearby schools including Alice A. Macomber Primary School, Westport Elementary School, and Westport Middle-High School.
Ownership History
Date
Name
Owned For
Owner Type
Purchase Details
Closed on
Feb 28, 1997
Sold by
Est Souza Agostinho P and Mulberry Hope S
Bought by
Roy Arthur E and Roy Louise T
Current Estimated Value
Create a Home Valuation Report for This Property
The Home Valuation Report is an in-depth analysis detailing your home's value as well as a comparison with similar homes in the area
Home Values in the Area
Average Home Value in this Area
Purchase History
| Date | Buyer | Sale Price | Title Company |
|---|---|---|---|
| Roy Arthur E | $54,000 | -- | |
| Roy Arthur E | $6,000 | -- |
Source: Public Records
Mortgage History
| Date | Status | Borrower | Loan Amount |
|---|---|---|---|
| Open | Roy Arthur E | $180,600 | |
| Closed | Roy Arthur E | $140,000 | |
| Closed | Roy Arthur E | $106,000 | |
| Closed | Roy Arthur E | $12,416 |
Source: Public Records
Tax History Compared to Growth
Tax History
| Year | Tax Paid | Tax Assessment Tax Assessment Total Assessment is a certain percentage of the fair market value that is determined by local assessors to be the total taxable value of land and additions on the property. | Land | Improvement |
|---|---|---|---|---|
| 2025 | $3,095 | $415,400 | $169,300 | $246,100 |
| 2024 | $3,038 | $393,000 | $150,300 | $242,700 |
| 2023 | $2,964 | $363,200 | $136,900 | $226,300 |
| 2022 | $2,855 | $336,700 | $136,900 | $199,800 |
| 2021 | $2,552 | $296,100 | $113,200 | $182,900 |
| 2020 | $2,457 | $291,500 | $108,600 | $182,900 |
| 2019 | $2,292 | $277,200 | $108,600 | $168,600 |
| 2018 | $1,815 | $222,200 | $109,800 | $112,400 |
| 2017 | $1,719 | $215,700 | $106,300 | $109,400 |
| 2016 | $1,679 | $212,200 | $102,800 | $109,400 |
| 2015 | $1,606 | $202,500 | $105,100 | $97,400 |
Source: Public Records
Map
Nearby Homes