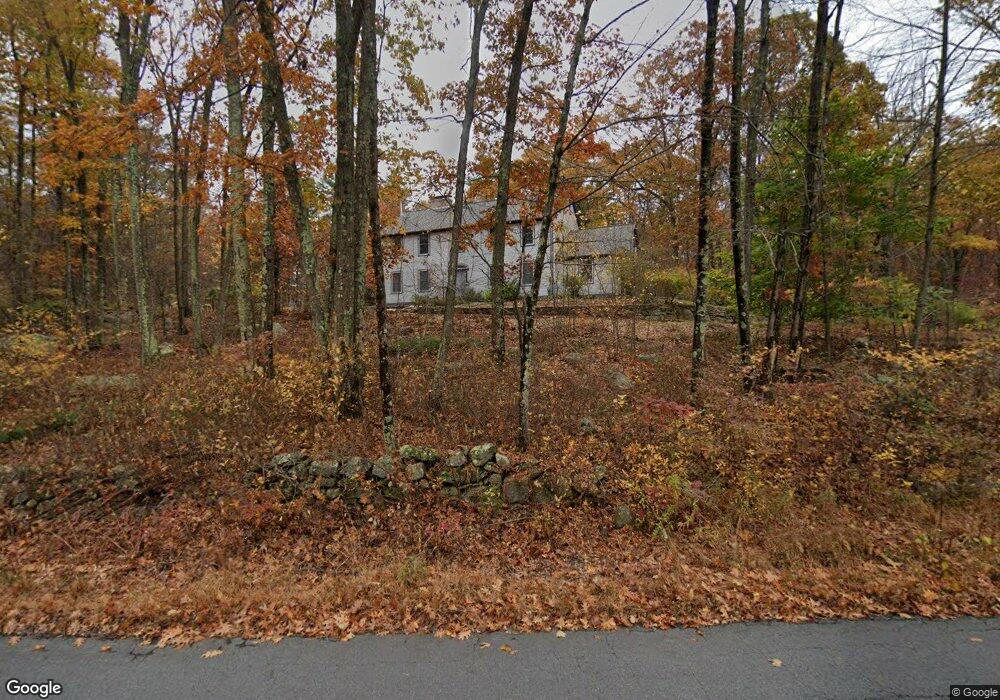
270 SE Main St Douglas, MA 01516
Estimated Value: $786,000 - $1,092,000
4
Beds
3
Baths
4,140
Sq Ft
$222/Sq Ft
Est. Value
About This Home
This home is located at 270 SE Main St, Douglas, MA 01516 and is currently estimated at $918,027, approximately $221 per square foot. 270 SE Main St is a home located in Worcester County with nearby schools including Douglas Primary School, Douglas Middle School, and Douglas High School.
Ownership History
Date
Name
Owned For
Owner Type
Purchase Details
Closed on
Nov 12, 2014
Sold by
Temple Kenneth and Crecelius Cheryl S
Bought by
Temple Ft and Crecelius Cheryl S
Current Estimated Value
Purchase Details
Closed on
May 28, 1985
Bought by
Temple Ft
Create a Home Valuation Report for This Property
The Home Valuation Report is an in-depth analysis detailing your home's value as well as a comparison with similar homes in the area
Home Values in the Area
Average Home Value in this Area
Purchase History
| Date | Buyer | Sale Price | Title Company |
|---|---|---|---|
| Temple Ft | -- | -- | |
| Temple Ft | $20,000 | -- |
Source: Public Records
Mortgage History
| Date | Status | Borrower | Loan Amount |
|---|---|---|---|
| Previous Owner | Temple Ft | $20,000 | |
| Previous Owner | Temple Ft | $120,000 |
Source: Public Records
Tax History
| Year | Tax Paid | Tax Assessment Tax Assessment Total Assessment is a certain percentage of the fair market value that is determined by local assessors to be the total taxable value of land and additions on the property. | Land | Improvement |
|---|---|---|---|---|
| 2025 | $9,983 | $758,000 | $101,500 | $656,500 |
| 2024 | $9,884 | $731,100 | $92,200 | $638,900 |
| 2023 | $9,578 | $667,000 | $92,200 | $574,800 |
| 2022 | $10,038 | $614,300 | $85,500 | $528,800 |
| 2021 | $9,967 | $596,100 | $81,400 | $514,700 |
| 2020 | $9,690 | $570,700 | $81,400 | $489,300 |
| 2019 | $9,714 | $555,100 | $81,400 | $473,700 |
| 2018 | $10,352 | $539,300 | $81,400 | $457,900 |
| 2017 | $8,494 | $508,000 | $84,700 | $423,300 |
| 2016 | $8,205 | $487,800 | $84,700 | $403,100 |
| 2015 | $8,029 | $487,800 | $84,700 | $403,100 |
Source: Public Records
Map
Nearby Homes
- 279 S East Main St Unit Lot 2
- 32 Linden St
- 13 Perry St
- 0 White Ct (Lot 3 - Left Side)
- 22 Mystic Valley Ln
- 20 Vine St
- 296 Yew St
- 240 South St
- 38 Hemlock St
- 25 Stanphyl Rd
- 10 Essex St
- 99 Maple St
- 11 Walnut St
- 0 E Wallum Lake Rd Unit 1408544
- 48 Walnut St
- 153 Davis St
- 405 West St
- 145 Turner Farm Rd
- 139 Turner Farm Rd
- 22 Eagle Dr Unit 22
- 273 S East Main St
- 278 SE Main St
- 25 Linden St
- 19 Linden St
- 15 Linden St
- 282 SE Main St
- 279 S East Main St
- 9 Linden St
- 260 SE Main St
- 287 S East Main St Unit Lot 4
- 287 S East Main St
- 35 Linden St
- 4 Pine St
- LOT 2 Linden St
- LOT 1 Linden St
- 10 Pine St
- 1A Pine St
- 295 S East Main St Unit Lot 6
- 1 Pine St
- 2 Pine St
Your Personal Tour Guide
Ask me questions while you tour the home.