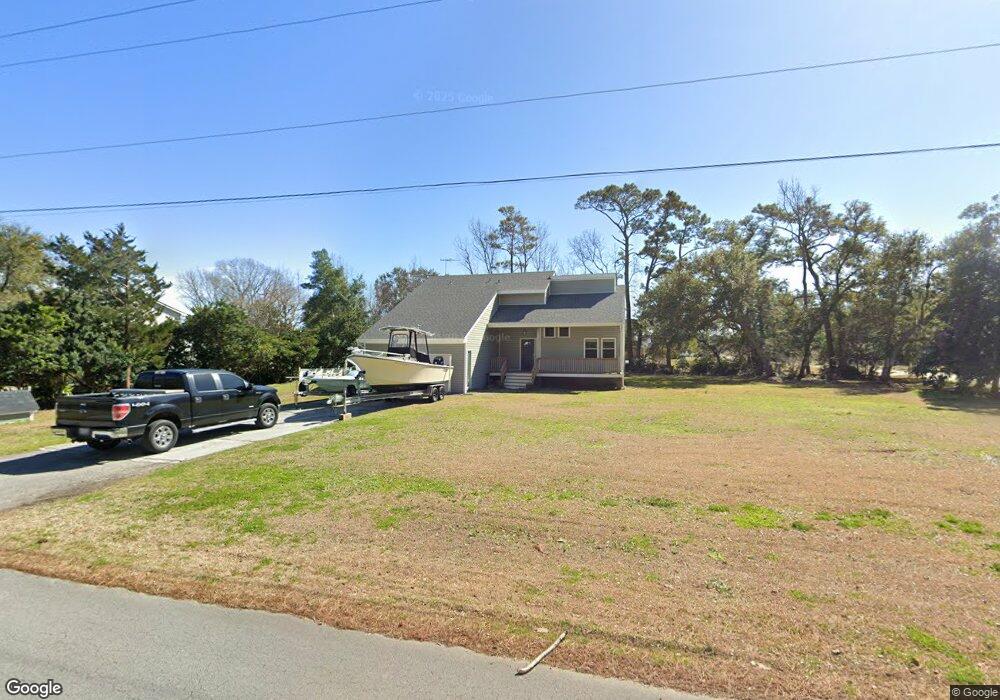
270 Steep Point Rd Beaufort, NC 28516
Estimated Value: $302,000 - $370,000
3
Beds
3
Baths
1,572
Sq Ft
$216/Sq Ft
Est. Value
About This Home
This home is located at 270 Steep Point Rd, Beaufort, NC 28516 and is currently estimated at $339,395, approximately $215 per square foot. 270 Steep Point Rd is a home located in Carteret County with nearby schools including Beaufort Elementary School, Beaufort Middle School, and East Carteret High School.
Ownership History
Date
Name
Owned For
Owner Type
Purchase Details
Closed on
Mar 30, 2017
Sold by
Coastal General Contracting Inc
Bought by
Byrum Jordan Scott
Current Estimated Value
Home Financials for this Owner
Home Financials are based on the most recent Mortgage that was taken out on this home.
Original Mortgage
$96,900
Outstanding Balance
$80,503
Interest Rate
4.15%
Mortgage Type
Unknown
Estimated Equity
$258,892
Purchase Details
Closed on
Jan 20, 2017
Sold by
Greene Erin Hayley and Greene Thomas Lee
Bought by
Coastal General Contracting Inc
Home Financials for this Owner
Home Financials are based on the most recent Mortgage that was taken out on this home.
Original Mortgage
$200,754
Interest Rate
4.3%
Mortgage Type
Commercial
Create a Home Valuation Report for This Property
The Home Valuation Report is an in-depth analysis detailing your home's value as well as a comparison with similar homes in the area
Home Values in the Area
Average Home Value in this Area
Purchase History
| Date | Buyer | Sale Price | Title Company |
|---|---|---|---|
| Byrum Jordan Scott | $114,000 | None Available | |
| Coastal General Contracting Inc | $70,000 | None Available |
Source: Public Records
Mortgage History
| Date | Status | Borrower | Loan Amount |
|---|---|---|---|
| Open | Byrum Jordan Scott | $96,900 | |
| Previous Owner | Coastal General Contracting Inc | $200,754 |
Source: Public Records
Tax History Compared to Growth
Tax History
| Year | Tax Paid | Tax Assessment Tax Assessment Total Assessment is a certain percentage of the fair market value that is determined by local assessors to be the total taxable value of land and additions on the property. | Land | Improvement |
|---|---|---|---|---|
| 2025 | $1,341 | $355,217 | $75,379 | $279,838 |
| 2024 | $1,043 | $188,952 | $63,218 | $125,734 |
| 2023 | $1,117 | $188,952 | $63,218 | $125,734 |
| 2022 | $1,098 | $188,952 | $63,218 | $125,734 |
| 2021 | $1,098 | $188,952 | $63,218 | $125,734 |
| 2020 | $1,049 | $188,952 | $63,218 | $125,734 |
| 2019 | $1,138 | $221,413 | $83,447 | $137,966 |
| 2017 | $1,143 | $221,413 | $83,447 | $137,966 |
| 2016 | $1,110 | $221,413 | $83,447 | $137,966 |
| 2015 | $1,088 | $221,413 | $83,447 | $137,966 |
| 2014 | $997 | $201,808 | $66,006 | $135,802 |
Source: Public Records
Map
Nearby Homes
- 280 Steep Point Rd
- 152 Steep Point Rd
- Lot 8 Steep Point Rd
- 101 Gibbs Ct
- 117 Gibbs Ct
- 290 Steep Point Rd
- 125 Gibbs Ct
- 306 Steep Point Rd
- 120 Gibbs Creek Rd
- 143 Gibbs Creek Rd
- 135 Gibbs Ct
- 114 Gibbs Ct
- 308 Steep Point Rd
- 147 Gibbs Ct
- 316 Steep Point Rd
- 155 Gibbs Creek Rd
- 332 Steep Point Rd
- 167 Gibbs Ct
- 187 Gibbs Creek Rd
- 193 Gibbs Creek Rd