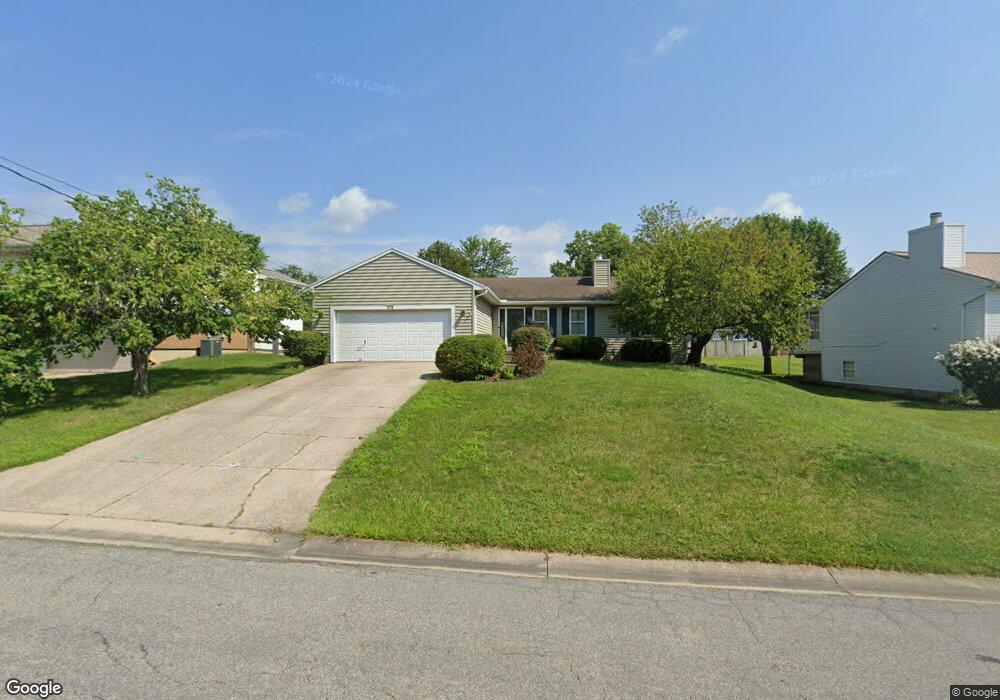
270 Stillpass Way Monroe, OH 45050
Estimated Value: $292,354 - $322,000
3
Beds
3
Baths
1,404
Sq Ft
$220/Sq Ft
Est. Value
About This Home
This home is located at 270 Stillpass Way, Monroe, OH 45050 and is currently estimated at $308,839, approximately $219 per square foot. 270 Stillpass Way is a home located in Butler County with nearby schools including Independence Elementary School, Liberty Junior School, and Lakota East High School.
Ownership History
Date
Name
Owned For
Owner Type
Purchase Details
Closed on
Aug 25, 2003
Sold by
Hodges Jerry W
Bought by
Hodges Julia A
Current Estimated Value
Purchase Details
Closed on
Apr 30, 2003
Sold by
Barlow Jeffrey S and Barlow Pamela A
Bought by
Hodges Julia A
Home Financials for this Owner
Home Financials are based on the most recent Mortgage that was taken out on this home.
Original Mortgage
$123,000
Outstanding Balance
$54,353
Interest Rate
6.02%
Mortgage Type
Purchase Money Mortgage
Estimated Equity
$254,486
Purchase Details
Closed on
Aug 4, 1995
Sold by
Sparks Timothy W
Bought by
Barlow Jeffrey S and Barlow Pamela
Home Financials for this Owner
Home Financials are based on the most recent Mortgage that was taken out on this home.
Original Mortgage
$102,000
Interest Rate
7.56%
Mortgage Type
VA
Purchase Details
Closed on
Apr 1, 1991
Create a Home Valuation Report for This Property
The Home Valuation Report is an in-depth analysis detailing your home's value as well as a comparison with similar homes in the area
Home Values in the Area
Average Home Value in this Area
Purchase History
| Date | Buyer | Sale Price | Title Company |
|---|---|---|---|
| Hodges Julia A | -- | -- | |
| Hodges Julia A | $141,000 | -- | |
| Barlow Jeffrey S | $100,000 | -- | |
| -- | $85,500 | -- |
Source: Public Records
Mortgage History
| Date | Status | Borrower | Loan Amount |
|---|---|---|---|
| Open | Hodges Julia A | $123,000 | |
| Previous Owner | Barlow Jeffrey S | $102,000 |
Source: Public Records
Tax History Compared to Growth
Tax History
| Year | Tax Paid | Tax Assessment Tax Assessment Total Assessment is a certain percentage of the fair market value that is determined by local assessors to be the total taxable value of land and additions on the property. | Land | Improvement |
|---|---|---|---|---|
| 2024 | $2,749 | $80,000 | $10,570 | $69,430 |
| 2023 | $2,731 | $80,000 | $10,570 | $69,430 |
| 2022 | $2,518 | $58,670 | $10,570 | $48,100 |
| 2021 | $2,501 | $58,670 | $10,570 | $48,100 |
| 2020 | $2,574 | $58,670 | $10,570 | $48,100 |
| 2019 | $4,295 | $47,810 | $11,470 | $36,340 |
| 2018 | $2,348 | $47,810 | $11,470 | $36,340 |
| 2017 | $2,396 | $47,810 | $11,470 | $36,340 |
| 2016 | $2,249 | $42,270 | $11,470 | $30,800 |
| 2015 | $2,252 | $42,270 | $11,470 | $30,800 |
| 2014 | $2,483 | $42,270 | $11,470 | $30,800 |
| 2013 | $2,483 | $45,020 | $9,980 | $35,040 |
Source: Public Records
Map
Nearby Homes
- 20 Stillpass Way
- 881 Trails End Dr
- 130 Stonemill Ct
- 160 Gorman Ct
- 7498 Cherokee Ln
- 8006 Summerlin Ct
- 180 Sackett Dr
- 95 Paddock Ln
- 5167 Cincinnati Dayton Rd
- 5169 Oak Forest Dr
- 157 Lena Dr
- 389 Timrick Place
- 1 Kyles Station Rd
- 0 Wayne Madison Unit 1861405
- 5326 Elmwood Ln
- 201 Moder Dr
- 589 Lebanon St
- 225 Mason Ave
- 7574 Woodmere Ct
- 7542 Hickory Knoll Dr
- 280 Stillpass Way
- 260 Stillpass Way
- 970 Obenour Ct
- 290 Stillpass Way
- 250 Stillpass Way
- 960 Obenour Ct
- 275 Stillpass Way
- 265 Stillpass Way
- 285 Stillpass Way
- 300 Stillpass Way
- 240 Stillpass Way
- 970 Rustic Ct
- 980 Rustic Ct
- 295 Stillpass Way
- 255 Stillpass Way
- 965 Obenour Ct
- 950 Obenour Ct
- 901 Joy Dr
- 420 Stillpass Way
- 245 Stillpass Way