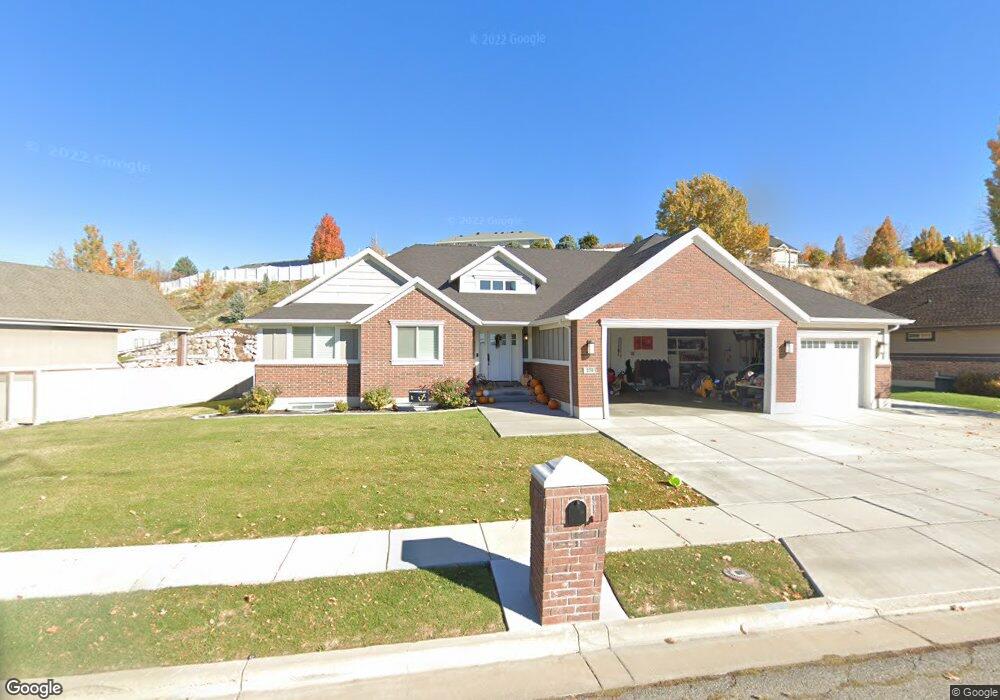
270 W 5700 S Unit 20 Washington Terrace, UT 84405
Estimated Value: $584,000 - $691,953
5
Beds
3
Baths
1,671
Sq Ft
$394/Sq Ft
Est. Value
About This Home
This home is located at 270 W 5700 S Unit 20, Washington Terrace, UT 84405 and is currently estimated at $657,738, approximately $393 per square foot. 270 W 5700 S Unit 20 is a home located in Weber County with nearby schools including Roosevelt School, T.H. Bell Junior High School, and Bonneville High School.
Ownership History
Date
Name
Owned For
Owner Type
Purchase Details
Closed on
Aug 21, 2017
Sold by
Pacific Point Properties Llc
Bought by
Dixon Kurtis and Dixon Mindi
Current Estimated Value
Home Financials for this Owner
Home Financials are based on the most recent Mortgage that was taken out on this home.
Original Mortgage
$271,825
Outstanding Balance
$229,456
Interest Rate
4.4%
Mortgage Type
FHA
Estimated Equity
$428,282
Purchase Details
Closed on
Jan 20, 2016
Sold by
Bustamante Ivan W
Bought by
Pacific Point Properties Llc
Purchase Details
Closed on
Sep 14, 2006
Sold by
Southtown Properties Inc
Bought by
Bustamante Ivan W
Home Financials for this Owner
Home Financials are based on the most recent Mortgage that was taken out on this home.
Original Mortgage
$68,720
Interest Rate
6.56%
Mortgage Type
Purchase Money Mortgage
Purchase Details
Closed on
Sep 27, 2004
Sold by
Anchor Land & Cattle Llc
Bought by
Southtown Properties Inc
Create a Home Valuation Report for This Property
The Home Valuation Report is an in-depth analysis detailing your home's value as well as a comparison with similar homes in the area
Home Values in the Area
Average Home Value in this Area
Purchase History
| Date | Buyer | Sale Price | Title Company |
|---|---|---|---|
| Dixon Kurtis | -- | Mountain View Title | |
| Pacific Point Properties Llc | -- | First American Title | |
| Bustamante Ivan W | -- | Heritage West | |
| Southtown Properties Inc | -- | -- |
Source: Public Records
Mortgage History
| Date | Status | Borrower | Loan Amount |
|---|---|---|---|
| Open | Dixon Kurtis | $271,825 | |
| Previous Owner | Bustamante Ivan W | $68,720 |
Source: Public Records
Tax History Compared to Growth
Tax History
| Year | Tax Paid | Tax Assessment Tax Assessment Total Assessment is a certain percentage of the fair market value that is determined by local assessors to be the total taxable value of land and additions on the property. | Land | Improvement |
|---|---|---|---|---|
| 2025 | $3,844 | $642,082 | $225,653 | $416,429 |
| 2024 | $3,844 | $345,399 | $124,109 | $221,290 |
| 2023 | $3,915 | $352,550 | $110,283 | $242,267 |
| 2022 | $3,874 | $357,500 | $93,735 | $263,765 |
| 2021 | $3,346 | $510,000 | $100,372 | $409,628 |
| 2020 | $3,041 | $423,000 | $85,287 | $337,713 |
| 2019 | $3,029 | $394,000 | $75,277 | $318,723 |
| 2018 | $2,816 | $362,000 | $75,277 | $286,723 |
| 2017 | $2,955 | $362,000 | $75,277 | $286,723 |
| 2016 | $1,054 | $66,845 | $66,845 | $0 |
| 2015 | $987 | $61,833 | $61,833 | $0 |
| 2014 | $910 | $56,819 | $56,819 | $0 |
Source: Public Records
Map
Nearby Homes
- 295 W 5650 S
- 5465 S 250 W
- 5530 S 100 W
- 376 W 5300 S
- 5282 S 575 W
- 5226 S 200 W
- 5155 S Ridgeline Dr
- 405 W 5100 S
- 5454 S 150 E Unit 39
- 445 W 5100 S
- 548 W 5150 S
- 5488 S 250 E
- 283 E 5450 S Unit 20
- 390 W 5050 S
- 5420 S 350 E Unit 43
- 6363 S Suzanne St Unit 117
- 246 W 5000 S
- 6373 S Suzanne St Unit 115
- 1500 N Spring Creek Ln E
- 5033 S 150 E
- 270 W 5700 S
- 284 W 5700 S
- 284 W 5700 S Unit 21
- 266 W 5700 S
- 266 W 5700 S Unit 19
- 285 W 5600 S
- 296 W 5650 S
- 267 W 5700 S
- 267 W 5700 S Unit 18
- 271 W 5700 S
- 281 W 5600 S
- 283 W 5700 S Unit 16
- 283 W 5700 S
- 297 W 5600 S
- 254 W 5700 S Unit 1
- 302 W 5650 S
- 295 W 5650 S Unit 15
- 277 W 5600 S
- 286 W 5600 S
- 280 W 5600 S