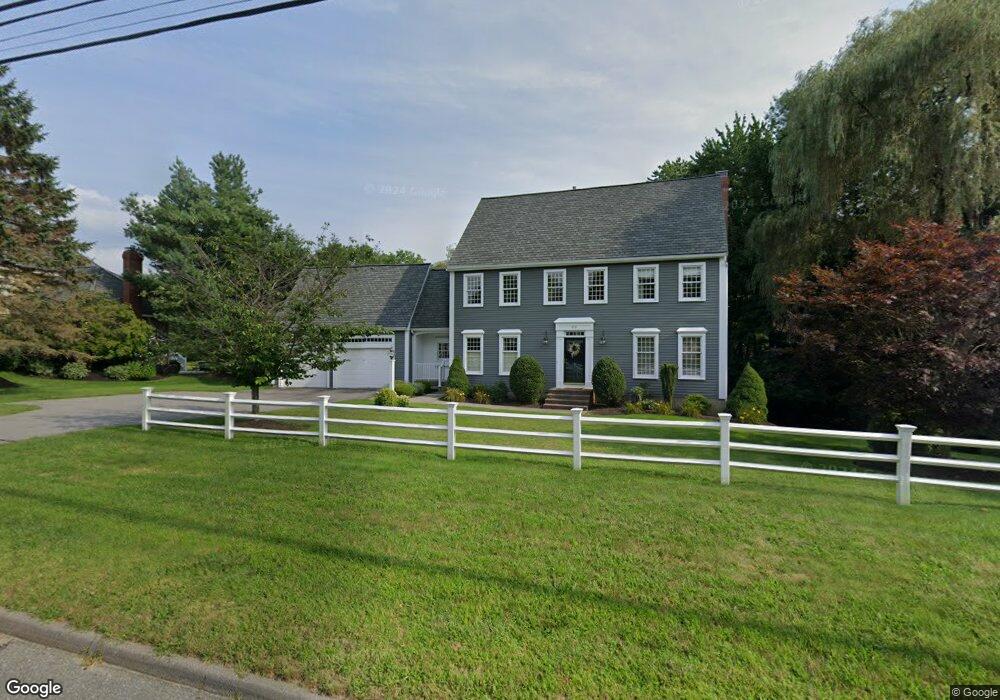
270 W Main St Westborough, MA 01581
Estimated Value: $1,018,438 - $1,173,000
4
Beds
3
Baths
2,566
Sq Ft
$419/Sq Ft
Est. Value
About This Home
This home is located at 270 W Main St, Westborough, MA 01581 and is currently estimated at $1,075,110, approximately $418 per square foot. 270 W Main St is a home located in Worcester County with nearby schools including Westborough High School, Ebridge Montessori School, and Westboro Knowledge Beginnings.
Ownership History
Date
Name
Owned For
Owner Type
Purchase Details
Closed on
Jun 26, 2007
Sold by
Pittorino Dorothy A and Pittorino Gerald J
Bought by
Vaccarino Alexis and Vaccarino Anthony
Current Estimated Value
Purchase Details
Closed on
Aug 1, 2003
Sold by
Fleisher David W and Fleisher Ingeborg L
Bought by
Pittorino Dorothy A and Pittorino Gerald J
Purchase Details
Closed on
Aug 3, 1995
Sold by
Abu Construction Inc
Bought by
Fleisher David W
Create a Home Valuation Report for This Property
The Home Valuation Report is an in-depth analysis detailing your home's value as well as a comparison with similar homes in the area
Home Values in the Area
Average Home Value in this Area
Purchase History
| Date | Buyer | Sale Price | Title Company |
|---|---|---|---|
| Vaccarino Alexis | $568,500 | -- | |
| Pittorino Dorothy A | $540,000 | -- | |
| Fleisher David W | $80,000 | -- |
Source: Public Records
Mortgage History
| Date | Status | Borrower | Loan Amount |
|---|---|---|---|
| Open | Fleisher David W | $60,000 | |
| Open | Fleisher David W | $410,000 |
Source: Public Records
Tax History Compared to Growth
Tax History
| Year | Tax Paid | Tax Assessment Tax Assessment Total Assessment is a certain percentage of the fair market value that is determined by local assessors to be the total taxable value of land and additions on the property. | Land | Improvement |
|---|---|---|---|---|
| 2025 | $14,874 | $913,100 | $329,400 | $583,700 |
| 2024 | $14,085 | $858,300 | $306,300 | $552,000 |
| 2023 | $13,048 | $774,800 | $290,400 | $484,400 |
| 2022 | $12,144 | $656,800 | $230,800 | $426,000 |
| 2021 | $11,710 | $631,600 | $205,600 | $426,000 |
| 2020 | $11,536 | $629,700 | $214,000 | $415,700 |
| 2019 | $11,627 | $634,300 | $214,000 | $420,300 |
| 2018 | $10,618 | $575,200 | $199,300 | $375,900 |
| 2017 | $10,239 | $575,200 | $199,300 | $375,900 |
| 2016 | $10,097 | $568,200 | $188,800 | $379,400 |
| 2015 | $10,059 | $541,100 | $188,800 | $352,300 |
Source: Public Records
Map
Nearby Homes
- 1 Benjamin Dr
- 29 Kay St
- 71 Nourse St
- 22 Capt Samuel Forbush Rd
- 37 Libbey Ln
- 41 Adams St
- 30 Old Nourse St
- 17 Olde Hickory Path
- LL39 Libbey Ln
- 10 Linda St
- 14 Nourse St
- 12 Appleseed Dr
- LC3 Liberty Cir
- 192 W Main St
- 2 Libbey Ln
- 11 Quick Farm Rd
- 9 Baldwin Ct
- 5 Blossom Ct Unit 5
- 49 Arch St Unit 2
- 61 Wesson St