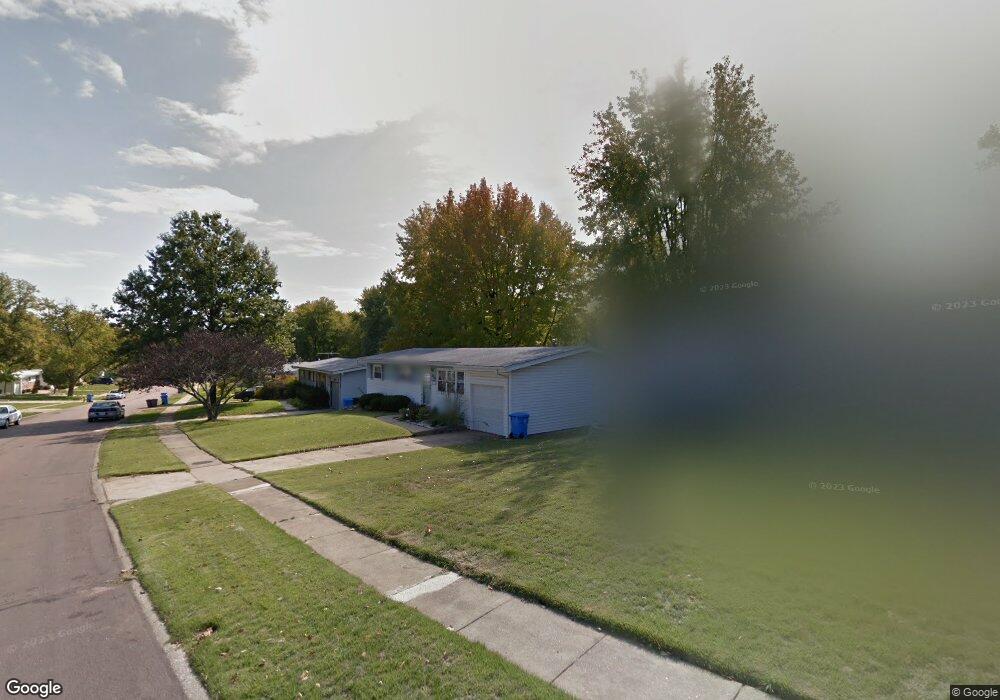
2700 Dove Dr Florissant, MO 63031
Estimated Value: $142,000 - $178,000
3
Beds
2
Baths
1,025
Sq Ft
$160/Sq Ft
Est. Value
About This Home
This home is located at 2700 Dove Dr, Florissant, MO 63031 and is currently estimated at $164,246, approximately $160 per square foot. 2700 Dove Dr is a home located in St. Louis County with nearby schools including Lusher Elementary School, Northwest Middle School, and Hazelwood West High School.
Ownership History
Date
Name
Owned For
Owner Type
Purchase Details
Closed on
Jul 29, 2022
Sold by
Edwards and Nancy
Bought by
Stein Gabriel
Current Estimated Value
Home Financials for this Owner
Home Financials are based on the most recent Mortgage that was taken out on this home.
Original Mortgage
$128,135
Outstanding Balance
$122,631
Interest Rate
5.81%
Mortgage Type
FHA
Estimated Equity
$41,615
Purchase Details
Closed on
Aug 26, 2016
Sold by
Felmlee Bradly J and Felmlee Elizabeth L
Bought by
Edwards Phillip and Edwards Nancy L
Purchase Details
Closed on
Feb 29, 2008
Sold by
Felmlee Bradly J and Felmlee Katherine M
Bought by
Felmlee Bradly J
Purchase Details
Closed on
Mar 20, 2003
Sold by
Scheer Shirley L
Bought by
Felmlee Bradly J and Brackett Katherine M
Home Financials for this Owner
Home Financials are based on the most recent Mortgage that was taken out on this home.
Original Mortgage
$98,800
Interest Rate
5.83%
Mortgage Type
Purchase Money Mortgage
Create a Home Valuation Report for This Property
The Home Valuation Report is an in-depth analysis detailing your home's value as well as a comparison with similar homes in the area
Home Values in the Area
Average Home Value in this Area
Purchase History
| Date | Buyer | Sale Price | Title Company |
|---|---|---|---|
| Stein Gabriel | -- | Investors Title | |
| Edwards Phillip | $61,000 | Investors Title Co Clayton | |
| Felmlee Bradly J | -- | None Available | |
| Felmlee Bradly J | $104,000 | -- |
Source: Public Records
Mortgage History
| Date | Status | Borrower | Loan Amount |
|---|---|---|---|
| Open | Stein Gabriel | $128,135 | |
| Previous Owner | Felmlee Bradly J | $98,800 | |
| Closed | Stein Gabriel | $5,125 |
Source: Public Records
Tax History Compared to Growth
Tax History
| Year | Tax Paid | Tax Assessment Tax Assessment Total Assessment is a certain percentage of the fair market value that is determined by local assessors to be the total taxable value of land and additions on the property. | Land | Improvement |
|---|---|---|---|---|
| 2025 | $2,414 | $30,500 | $5,610 | $24,890 |
| 2024 | $2,414 | $26,960 | $3,210 | $23,750 |
| 2023 | $2,411 | $26,960 | $3,210 | $23,750 |
| 2022 | $2,171 | $21,620 | $4,160 | $17,460 |
| 2021 | $2,114 | $21,620 | $4,160 | $17,460 |
| 2020 | $1,829 | $17,560 | $3,210 | $14,350 |
| 2019 | $1,801 | $17,560 | $3,210 | $14,350 |
| 2018 | $1,874 | $16,820 | $2,470 | $14,350 |
| 2017 | $1,872 | $16,820 | $2,470 | $14,350 |
| 2016 | $1,726 | $15,280 | $2,850 | $12,430 |
| 2015 | $1,690 | $15,280 | $2,850 | $12,430 |
| 2014 | $1,716 | $16,000 | $3,800 | $12,200 |
Source: Public Records
Map
Nearby Homes
- 1767 Stilton Ct
- 1834 Night Dr
- 2216 Foggy Bottom Dr
- 2171 Farthing Ct
- 2 Meadows
- 2 Ashford at River Bluffs Manors
- 2 Berwick at River Bluffs Manors
- 2347 Farflung Dr
- 2 Meadows
- 2490 Mullanphy Ln
- 2 Maple at River Bluffs Manors
- 2 Royal II at River Bluffs Manors
- 2 Aspen II at River Bluffs Manors
- 2 Sterling at River Bluffs Manors
- 2 Fieldcrest at River Bluffs Meadows
- 2 Belmont at River Bluffs Meadows
- 2 Aspen at River Bluffs Manors Unit Aspen at River Bluff
- 2145 Flamingo Dr
- 2334 White Ash Ct
- 1911 Suns Up Ct Unit 4
- 2690 Dove Dr
- 2710 Dove Dr
- 2705 Mockingbird Ln
- 2670 Dove Dr
- 2730 Dove Dr
- 2695 Mockingbird Ln
- 2715 Mockingbird Ln
- 2705 Dove Dr
- 2695 Dove Dr
- 2675 Mockingbird Ln
- 2715 Dove Dr
- 2675 Dove Dr
- 2660 Dove Dr
- 2725 Mockingbird Ln
- 2750 Dove Dr
- 2725 Dove Dr
- 2665 Dove Dr
- 2665 Mockingbird Ln
- 2745 Mockingbird Ln
- 2745 Dove Dr