2700 Lampman Rd Ferndale, WA 98248
Estimated Value: $557,564
--
Bed
--
Bath
896
Sq Ft
$622/Sq Ft
Est. Value
About This Home
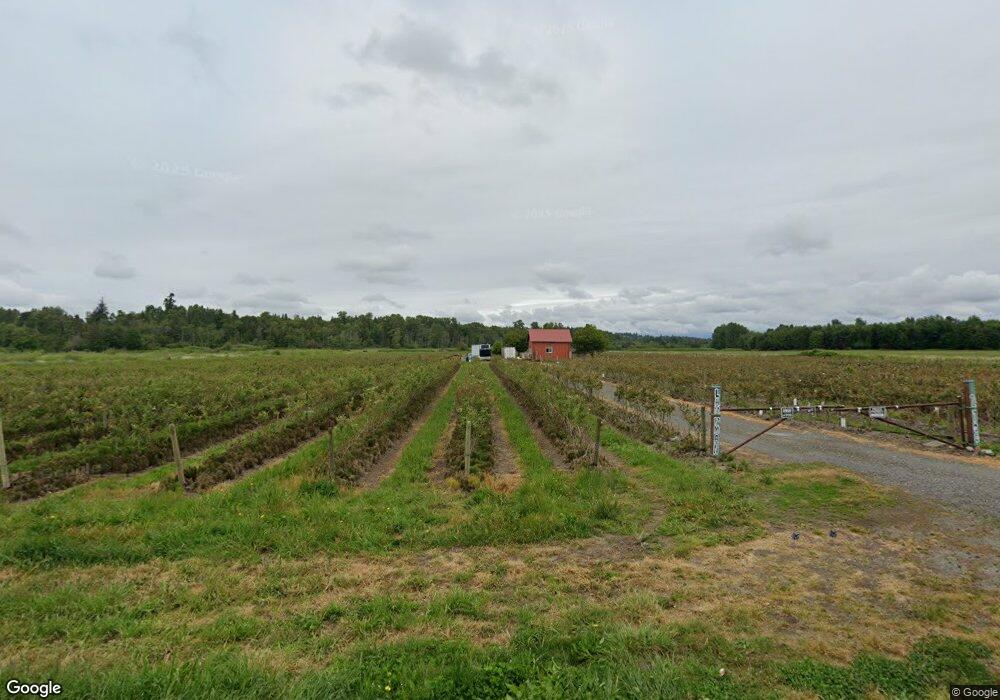
This home is located at 2700 Lampman Rd, Ferndale, WA 98248 and is currently estimated at $557,564, approximately $622 per square foot. 2700 Lampman Rd is a home located in Whatcom County with nearby schools including Eagleridge Elementary School, Horizon Middle School, and Ferndale High School.
Ownership History
Date
Name
Owned For
Owner Type
Purchase Details
Closed on
May 28, 2025
Sold by
Johal Dalbir and Johal Mohinder
Bought by
Bal Farms Llc
Current Estimated Value
Home Financials for this Owner
Home Financials are based on the most recent Mortgage that was taken out on this home.
Original Mortgage
$592,250
Outstanding Balance
$591,220
Interest Rate
5.5%
Mortgage Type
New Conventional
Estimated Equity
-$33,656
Purchase Details
Closed on
Oct 8, 2017
Sold by
Johal Dalbir
Bought by
Johal Dalbir and Johal Mohinder
Purchase Details
Closed on
Aug 21, 2017
Sold by
Johal Makhan Singh
Bought by
Johal Dalbir
Purchase Details
Closed on
Jul 19, 2012
Sold by
Johal Arminder and Johal Jaya
Bought by
Johal Makhan Singh and Johal Dalbir
Purchase Details
Closed on
Feb 6, 2006
Sold by
Bradley Pauline
Bought by
Johal Makhan Singh and Johal Arminder
Purchase Details
Closed on
Jan 20, 1999
Sold by
Bradley Pauline
Bought by
Bradley Pauline
Create a Home Valuation Report for This Property
The Home Valuation Report is an in-depth analysis detailing your home's value as well as a comparison with similar homes in the area
Home Values in the Area
Average Home Value in this Area
Purchase History
| Date | Buyer | Sale Price | Title Company |
|---|---|---|---|
| Bal Farms Llc | $575,000 | None Listed On Document | |
| Johal Dalbir | -- | None Available | |
| Johal Dalbir | $240,000 | None Available | |
| Johal Makhan Singh | -- | None Available | |
| Johal Makhan Singh | $235,280 | First American Title Insuran | |
| Bradley Pauline | -- | -- |
Source: Public Records
Mortgage History
| Date | Status | Borrower | Loan Amount |
|---|---|---|---|
| Open | Bal Farms Llc | $592,250 |
Source: Public Records
Tax History Compared to Growth
Tax History
| Year | Tax Paid | Tax Assessment Tax Assessment Total Assessment is a certain percentage of the fair market value that is determined by local assessors to be the total taxable value of land and additions on the property. | Land | Improvement |
|---|---|---|---|---|
| 2024 | $933 | $579,048 | $567,299 | $11,749 |
| 2023 | $933 | $646,997 | $635,700 | $11,297 |
| 2022 | $1,064 | $507,684 | $496,049 | $11,635 |
| 2021 | $1,117 | $402,920 | $393,686 | $9,234 |
| 2020 | $997 | $72,176 | $64,350 | $7,826 |
| 2019 | $1,116 | $316,161 | $308,915 | $7,246 |
| 2018 | $1,345 | $6,600 | $0 | $6,600 |
| 2017 | $1,241 | $5,946 | $0 | $5,946 |
| 2016 | $1,041 | $2,270 | $0 | $2,270 |
| 2015 | $1,042 | $2,270 | $0 | $2,270 |
| 2014 | -- | $69,215 | $67,080 | $2,135 |
| 2013 | -- | $63,905 | $61,815 | $2,090 |
Source: Public Records
Map
Nearby Homes
- 0 XX Lampman Rd
- 1 Lampman Rd
- 5295 S Church Rd
- 2976 Upland Way
- 2788 Douglas Rd
- 3050 Slater Rd
- 0 Barr Rd Unit NWM2412290
- 4540 Haxton Way
- 5367 Barr Rd
- 5590 Farmstead Place
- 5587 Farmstead Place
- 5587 Farmstead Place Unit 5
- 5613 Farmstead Place
- 5593 Farmstead Place Unit 6
- 5591 Farmstead Place
- 2411 Barn Door Ct Unit 43
- 5591 Farmstead Place Unit 7
- 5590 Farmstead Place Unit 32
- 3210 W 51st Vista
- Elbert Plan at Douglas Farm
- 28 Haxton Way
- 2711 Lampman Rd
- 0 Lampman Rd Unit NWM1428603
- 0 Lampman Rd
- 2617 Lampman Rd
- 2630 Lampman Rd
- 5268 Olson Rd
- 5107 Olson Rd
- 0 Unick Rd
- 0 52xx Olson Rd
- 2855 W 53rd Ln
- 0 00XX Haxton Way Unit Lot 4
- 0 Lot A Haxton Way
- 0 Lot B Haxton Way
- 2931 Lampman Rd
- 1 Olson Rd
- 0 Olson Rd
- 5225 Olson Rd
- 5191 Olson Rd
- 5259 Olson Rd