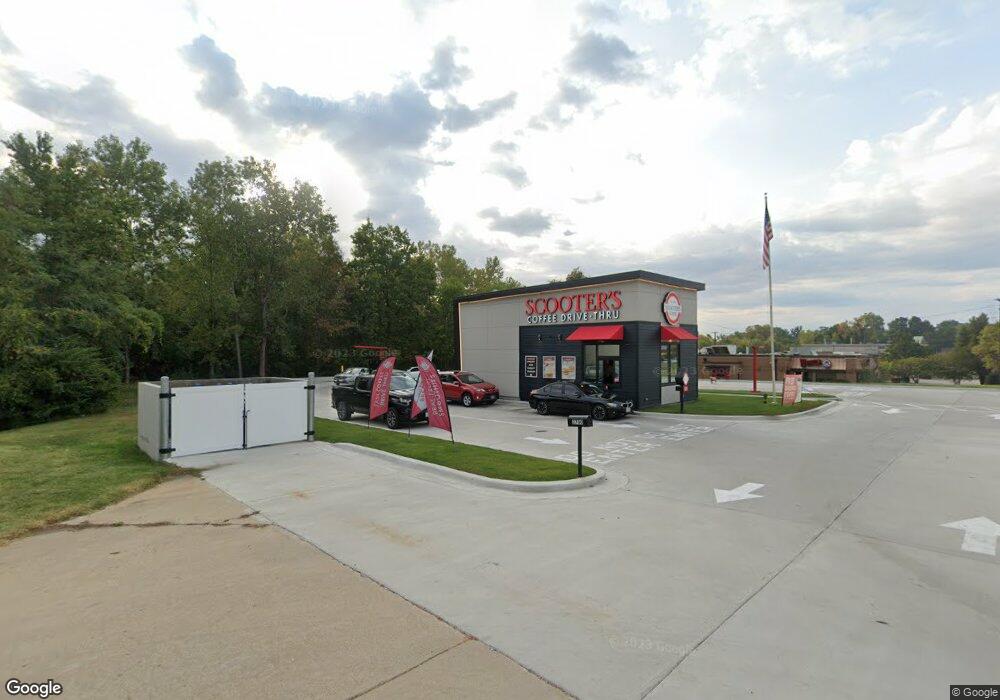
2700 N Illinois St Swansea, IL 62226
--
Bed
--
Bath
910
Sq Ft
1.22
Acres
About This Home
This home is located at 2700 N Illinois St, Swansea, IL 62226. 2700 N Illinois St is a home located in St. Clair County with nearby schools including Wolf Branch Elementary School, Wolf Branch Middle School, and Elite Scholars STEAM Academy.
Ownership History
Date
Name
Owned For
Owner Type
Purchase Details
Closed on
Jul 16, 2025
Sold by
Three Bhai Investment Llc
Bought by
Whoa N Go Metro East Llc
Purchase Details
Closed on
Jun 9, 2022
Sold by
K & R Capital Investments Llc
Bought by
Three Bhai Investment Llc
Home Financials for this Owner
Home Financials are based on the most recent Mortgage that was taken out on this home.
Original Mortgage
$264,000
Interest Rate
5.1%
Mortgage Type
Commercial
Purchase Details
Closed on
Mar 31, 2016
Sold by
D S C Development Llc
Bought by
K & R Capital Investments Llc
Home Financials for this Owner
Home Financials are based on the most recent Mortgage that was taken out on this home.
Original Mortgage
$320,000
Interest Rate
4.5%
Mortgage Type
Construction
Purchase Details
Closed on
Apr 26, 2006
Sold by
Bell Richard E
Bought by
D S C Development Llc
Home Financials for this Owner
Home Financials are based on the most recent Mortgage that was taken out on this home.
Original Mortgage
$361,000
Interest Rate
7.45%
Mortgage Type
Purchase Money Mortgage
Create a Home Valuation Report for This Property
The Home Valuation Report is an in-depth analysis detailing your home's value as well as a comparison with similar homes in the area
Home Values in the Area
Average Home Value in this Area
Purchase History
| Date | Buyer | Sale Price | Title Company |
|---|---|---|---|
| Whoa N Go Metro East Llc | $1,190,000 | None Available | |
| Three Bhai Investment Llc | $330,000 | Benchmark Title | |
| K & R Capital Investments Llc | $317,000 | Fatic | |
| D S C Development Llc | $386,000 | Town & Country Title Co |
Source: Public Records
Mortgage History
| Date | Status | Borrower | Loan Amount |
|---|---|---|---|
| Previous Owner | Three Bhai Investment Llc | $264,000 | |
| Previous Owner | K & R Capital Investments Llc | $320,000 | |
| Previous Owner | D S C Development Llc | $361,000 |
Source: Public Records
Tax History Compared to Growth
Tax History
| Year | Tax Paid | Tax Assessment Tax Assessment Total Assessment is a certain percentage of the fair market value that is determined by local assessors to be the total taxable value of land and additions on the property. | Land | Improvement |
|---|---|---|---|---|
| 2024 | $11,273 | $140,241 | $82,655 | $57,586 |
| 2023 | $14,136 | $174,203 | $81,514 | $92,689 |
| 2022 | $13,251 | $158,655 | $74,239 | $84,416 |
| 2021 | $12,958 | $152,143 | $71,192 | $80,951 |
| 2020 | $12,616 | $141,688 | $66,300 | $75,388 |
| 2019 | $12,500 | $144,046 | $67,657 | $76,389 |
| 2018 | $12,191 | $140,369 | $65,930 | $74,439 |
| 2017 | $11,884 | $136,633 | $64,175 | $72,458 |
| 2016 | $11,798 | $131,923 | $61,963 | $69,960 |
| 2014 | $10,011 | $126,179 | $59,758 | $66,421 |
| 2013 | $10,575 | $126,179 | $59,758 | $66,421 |
Source: Public Records
Map
Nearby Homes
- 0 Smelting Works Rd
- 110 Fullerton Rd
- 212 Castellano Dr
- 117 Timber Dr
- 34 Twilight Dr
- 2 Mercury Dr
- 104 Britanna Dr
- 3434 Whistling Cove
- 155 Marilyn Ave
- 145 Marilyn Dr
- 3232 Joel Dr
- 1708 Anna Rose Dr
- 1518 William Ln
- 1900 N 17th St
- 1903 N 17th St
- 20 Chaucer Dr
- 17 Willowbrook Dr
- 3 Kings Ct
- 1419 Lebanon Ave
- 9 Lake Christine Dr
- 2710 N Illinois St
- 2704 N Illinois St Unit 102
- 2704 N Illinois St
- 2708 N Illinois St
- 2712 N Illinois St
- 301 McDonald Blvd
- 223 McDonald Blvd
- 309 Travis Dr
- 303 Travis Dr
- 217 McDonald Blvd
- 313 Travis Dr
- 304 Travis Dr
- 308 Travis Dr
- 306 Travis Dr
- 302 Travis Dr
- 2549 Smelting Works Rd
- 209 McDonald Blvd
- 237 Persimmon Dr
- 305 Chambers Blvd
- 2612 Smelting Works Rd