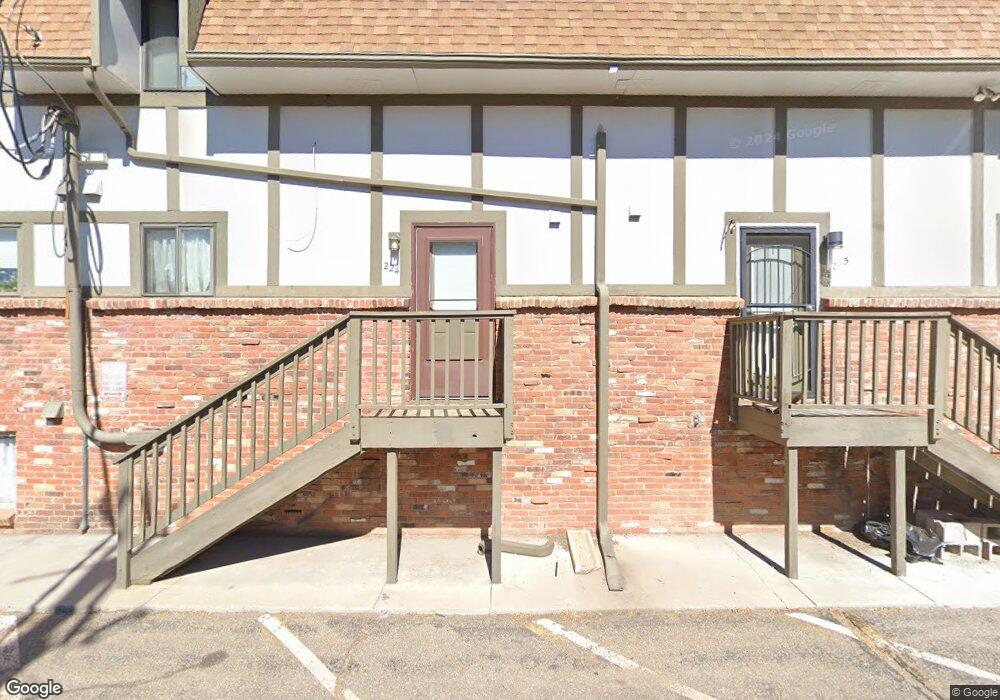
2700 S Holly St Unit 224 Denver, CO 80222
Hampden NeighborhoodEstimated Value: $210,000 - $250,000
2
Beds
2
Baths
890
Sq Ft
$260/Sq Ft
Est. Value
About This Home
This home is located at 2700 S Holly St Unit 224, Denver, CO 80222 and is currently estimated at $231,824, approximately $260 per square foot. 2700 S Holly St Unit 224 is a home located in Denver County with nearby schools including Bradley Elementary School, Hamilton Middle School, and Thomas Jefferson High School.
Ownership History
Date
Name
Owned For
Owner Type
Purchase Details
Closed on
Jul 1, 2013
Sold by
Stepul Oskana and Stepul Mykola
Bought by
Shawver Nancy Lee and Shawver Dorf Lauren Jeannine
Current Estimated Value
Purchase Details
Closed on
Jun 30, 2010
Sold by
Mitchell Maureen K
Bought by
Stepul Oksana and Stepul Mykola
Purchase Details
Closed on
Oct 27, 2000
Sold by
Odaniel Tracy S and Kummer Tracy S
Bought by
Mitchell Maureen K
Home Financials for this Owner
Home Financials are based on the most recent Mortgage that was taken out on this home.
Original Mortgage
$82,600
Interest Rate
7.9%
Purchase Details
Closed on
Aug 10, 2000
Sold by
Everhart Beverley A
Bought by
Odaniel Tracy S and Kummer Tracy S
Purchase Details
Closed on
Feb 2, 1992
Sold by
Odaniel Tracy S
Bought by
Odaniel Tracy S and Everhart Beverley A
Create a Home Valuation Report for This Property
The Home Valuation Report is an in-depth analysis detailing your home's value as well as a comparison with similar homes in the area
Home Values in the Area
Average Home Value in this Area
Purchase History
| Date | Buyer | Sale Price | Title Company |
|---|---|---|---|
| Shawver Nancy Lee | $74,500 | Chicago Title Co | |
| Stepul Oksana | $56,000 | Heritage Title | |
| Mitchell Maureen K | $108,000 | Stewart Title | |
| Odaniel Tracy S | -- | -- | |
| Odaniel Tracy S | -- | -- |
Source: Public Records
Mortgage History
| Date | Status | Borrower | Loan Amount |
|---|---|---|---|
| Previous Owner | Mitchell Maureen K | $82,600 | |
| Closed | Mitchell Maureen K | $20,000 |
Source: Public Records
Tax History Compared to Growth
Tax History
| Year | Tax Paid | Tax Assessment Tax Assessment Total Assessment is a certain percentage of the fair market value that is determined by local assessors to be the total taxable value of land and additions on the property. | Land | Improvement |
|---|---|---|---|---|
| 2024 | $1,040 | $12,700 | $1,350 | $11,350 |
| 2023 | $1,019 | $12,700 | $1,350 | $11,350 |
| 2022 | $1,180 | $14,350 | $1,190 | $13,160 |
| 2021 | $1,142 | $14,760 | $1,220 | $13,540 |
| 2020 | $1,097 | $14,260 | $1,220 | $13,040 |
| 2019 | $1,067 | $14,260 | $1,220 | $13,040 |
| 2018 | $666 | $8,320 | $1,090 | $7,230 |
| 2017 | $664 | $8,320 | $1,090 | $7,230 |
| 2016 | $537 | $6,370 | $557 | $5,813 |
| 2015 | $515 | $6,370 | $557 | $5,813 |
| 2014 | $409 | $4,770 | $764 | $4,006 |
Source: Public Records
Map
Nearby Homes
- 2700 S Holly St Unit 206
- 2700 S Holly St
- 2700 S Holly St Unit 115
- 2700 S Holly St Unit 100
- 5661 E Amherst Ave
- 5620 E Amherst Ave
- 2696 S Jersey St
- 2921 S Holly Place
- 2781 S Kearney St
- 2821 S Kearney St
- 5610 E Cornell Ave
- 6102 E Yale Ave
- 2525 S Ivanhoe Place
- 2980 S Glencoe St
- 2815 S Locust St Unit F
- 2749 S Glencoe St
- 3067 S Holly Place
- 2907 S Locust St Unit 7A
- 2880 S Locust St Unit 300
- 2880 S Locust St Unit 305
- 2700 S Holly St Unit 302
- 2700 S Holly St Unit 301
- 2700 S Holly St Unit 231
- 2700 S Holly St
- 2700 S Holly St Unit 229
- 2700 S Holly St Unit 228
- 2700 S Holly St Unit 226
- 2700 S Holly St Unit 223
- 2700 S Holly St Unit 222
- 2700 S Holly St Unit 221
- 2700 S Holly St Unit 220
- 2700 S Holly St
- 2700 S Holly St
- 2700 S Holly St Unit 217
- 2700 S Holly St
- 2700 S Holly St Unit 215
- 2700 S Holly St Unit 214
- 2700 S Holly St Unit 212
- 2700 S Holly St
- 2700 S Holly St Unit 210