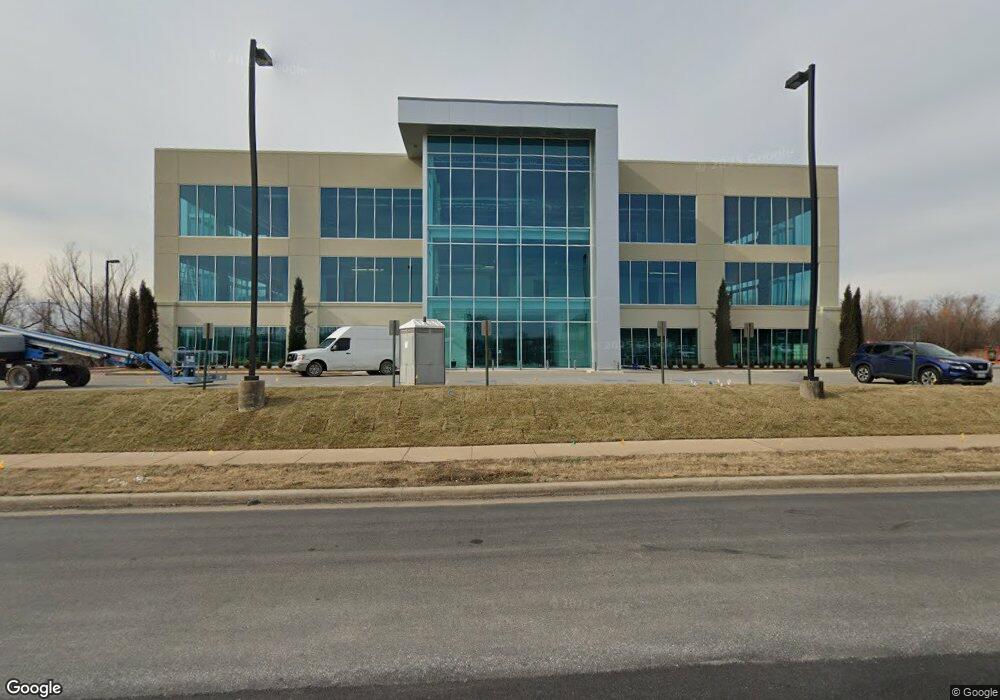
2700 SE S St Bentonville, AR 72712
Estimated Value: $13,199,970
--
Bed
--
Bath
38,184
Sq Ft
$346/Sq Ft
Est. Value
About This Home
This home is located at 2700 SE S St, Bentonville, AR 72712 and is currently estimated at $13,199,970, approximately $345 per square foot. 2700 SE S St is a home located in Benton County with nearby schools including Ruth Barker Middle School, R.E. Baker Elementary School, and Fulbright Junior High School.
Ownership History
Date
Name
Owned For
Owner Type
Purchase Details
Closed on
Feb 11, 2014
Sold by
Infinity S Street Llc
Bought by
Crossmar Investments Iv Llc
Current Estimated Value
Home Financials for this Owner
Home Financials are based on the most recent Mortgage that was taken out on this home.
Original Mortgage
$6,000,000
Outstanding Balance
$4,530,173
Interest Rate
4.47%
Estimated Equity
$8,669,797
Purchase Details
Closed on
Dec 19, 2007
Sold by
Landquest Holdings Llc
Bought by
Infinity S Street Llc
Purchase Details
Closed on
Mar 10, 2006
Sold by
Rescue Heroes Llc
Bought by
Landquest Holdings Llc
Home Financials for this Owner
Home Financials are based on the most recent Mortgage that was taken out on this home.
Original Mortgage
$6,080,000
Interest Rate
6.09%
Purchase Details
Closed on
Jun 26, 2003
Bought by
Fatlab
Create a Home Valuation Report for This Property
The Home Valuation Report is an in-depth analysis detailing your home's value as well as a comparison with similar homes in the area
Home Values in the Area
Average Home Value in this Area
Purchase History
| Date | Buyer | Sale Price | Title Company |
|---|---|---|---|
| Crossmar Investments Iv Llc | $6,500,000 | None Available | |
| Infinity S Street Llc | $4,650,000 | Triad Title Company | |
| Landquest Holdings Llc | $5,050,000 | First National Title Company | |
| Fatlab | $100,000 | -- |
Source: Public Records
Mortgage History
| Date | Status | Borrower | Loan Amount |
|---|---|---|---|
| Open | Crossmar Investments Iv Llc | $6,000,000 | |
| Previous Owner | Landquest Holdings Llc | $6,080,000 |
Source: Public Records
Tax History Compared to Growth
Tax History
| Year | Tax Paid | Tax Assessment Tax Assessment Total Assessment is a certain percentage of the fair market value that is determined by local assessors to be the total taxable value of land and additions on the property. | Land | Improvement |
|---|---|---|---|---|
| 2025 | $80,965 | $1,316,075 | $202,988 | $1,113,087 |
| 2024 | $81,333 | $1,316,075 | $202,988 | $1,113,087 |
| 2023 | $76,998 | $1,245,930 | $163,960 | $1,081,970 |
| 2022 | $78,867 | $1,245,930 | $163,960 | $1,081,970 |
| 2021 | $78,606 | $1,245,930 | $163,960 | $1,081,970 |
| 2020 | $74,539 | $1,170,160 | $147,500 | $1,022,660 |
| 2019 | $74,539 | $1,170,160 | $147,500 | $1,022,660 |
| 2018 | $74,539 | $1,170,160 | $147,500 | $1,022,660 |
| 2017 | $72,199 | $1,170,160 | $147,500 | $1,022,660 |
| 2016 | $72,199 | $1,170,160 | $147,500 | $1,022,660 |
| 2015 | $71,333 | $1,154,250 | $73,880 | $1,080,370 |
| 2014 | $71,333 | $1,154,250 | $73,880 | $1,080,370 |
Source: Public Records
Map
Nearby Homes
- 3319 Mp Pkwy Unit 203
- 3319 Mp Pkwy Unit 107
- 3330 Mp Pkwy Unit 304
- 3319 Mp Pkwy Unit 307
- 3330 Mp Pkwy Unit 104
- 3340 Mp Pkwy Unit 116
- 3319 Mp Pkwy Unit 105
- 3329 Mp Pkwy Unit 302
- 3330 Mp Pkwy Unit 206
- 3319 Mp Pkwy Unit 306
- 3319 Mp Pkwy Unit 206
- 3330 Mp Pkwy Unit 107
- 3319 Mp Pkwy Unit 303
- 3319 Mp Pkwy Unit 205
- 3330 Mp Pkwy Unit 302
- 3319 Mp Pkwy Unit 101
- 3330 Mp Pkwy Unit 303
- 3330 Mp Pkwy Unit 201
- 3330 Mp Pkwy Unit 308
- 3339 Mp Pkwy Unit 202
- 2700 S St
- 2713 SE Otis Corley Dr
- 2709 SE Otis Corley Dr Unit 19 & 21
- -- J St & 28th St L10
- 2703 Dr
- 000 Simple Savings Dr
- 000 Simple Savings Dr
- 2900 Medical Center Pkwy Unit 300
- 2900 Medical Center Pkwy Unit 300-301
- 2101 SE 25th St
- 2308 SE 28th St Unit 6
- 2308 SE 28th St Unit STE 8,9
- 2308 SE 28th St Unit 10&11
- 2308 SE 28th St Unit 2&3
- 2308 SE 28th St Unit 8
- 2308 SE 28th St Unit 1
- 2308 SE 28th St Unit 9&10
- 2308 SE 28th St Unit 7
- 2308 SE 28th St Unit 5
- 2308 SE 28th St Unit 5