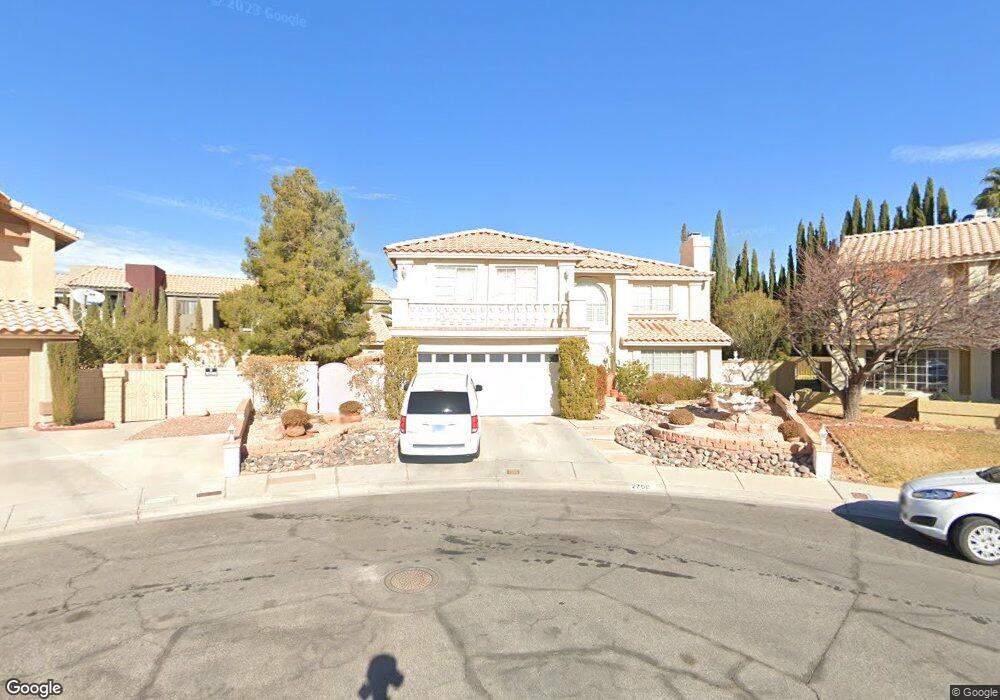
2700 Shady Pond Way Unit 8B Las Vegas, NV 89117
The Section Seven NeighborhoodEstimated Value: $583,000 - $642,992
4
Beds
3
Baths
2,655
Sq Ft
$235/Sq Ft
Est. Value
About This Home
This home is located at 2700 Shady Pond Way Unit 8B, Las Vegas, NV 89117 and is currently estimated at $624,748, approximately $235 per square foot. 2700 Shady Pond Way Unit 8B is a home located in Clark County with nearby schools including M J Christensen Elementary School, Clifford J Lawrence Junior High School, and Bonanza High School.
Ownership History
Date
Name
Owned For
Owner Type
Purchase Details
Closed on
Apr 4, 2001
Sold by
Federal National Mortgage Association
Bought by
Sara Michael and Sara Patricia A
Current Estimated Value
Home Financials for this Owner
Home Financials are based on the most recent Mortgage that was taken out on this home.
Original Mortgage
$206,150
Interest Rate
7.06%
Purchase Details
Closed on
Jan 20, 2001
Sold by
Benz Scallion Barbara and Scallion Jerry W
Bought by
Federal National Mortgage Association
Purchase Details
Closed on
Oct 4, 1994
Sold by
Scallion Jerry W
Bought by
Scallion Jerry W and Scallion Tammie
Home Financials for this Owner
Home Financials are based on the most recent Mortgage that was taken out on this home.
Original Mortgage
$12,895
Interest Rate
8.58%
Create a Home Valuation Report for This Property
The Home Valuation Report is an in-depth analysis detailing your home's value as well as a comparison with similar homes in the area
Home Values in the Area
Average Home Value in this Area
Purchase History
| Date | Buyer | Sale Price | Title Company |
|---|---|---|---|
| Sara Michael | $217,000 | Old Republic Title Company | |
| Federal National Mortgage Association | $167,509 | Ati Title | |
| Scallion Jerry W | -- | Nevada Title Company |
Source: Public Records
Mortgage History
| Date | Status | Borrower | Loan Amount |
|---|---|---|---|
| Open | Sara Michael | $399,000 | |
| Closed | Sara Michael | $399,000 | |
| Closed | Sara Michael | $136,000 | |
| Closed | Sara Michael | $83,500 | |
| Closed | Sara Michael | $50,000 | |
| Closed | Sara Michael | $360,000 | |
| Closed | Sara Michael | $300,200 | |
| Closed | Sara Michael | $42,000 | |
| Previous Owner | Sara Michael | $206,150 | |
| Previous Owner | Scallion Jerry W | $12,895 |
Source: Public Records
Tax History Compared to Growth
Tax History
| Year | Tax Paid | Tax Assessment Tax Assessment Total Assessment is a certain percentage of the fair market value that is determined by local assessors to be the total taxable value of land and additions on the property. | Land | Improvement |
|---|---|---|---|---|
| 2025 | $4,072 | $124,757 | $40,810 | $83,947 |
| 2024 | $3,771 | $124,757 | $40,810 | $83,947 |
| 2023 | $3,771 | $122,783 | $42,350 | $80,433 |
| 2022 | $3,492 | $107,150 | $32,725 | $74,425 |
| 2021 | $3,233 | $101,212 | $30,030 | $71,182 |
| 2020 | $2,999 | $99,245 | $28,105 | $71,140 |
| 2019 | $2,811 | $101,467 | $30,993 | $70,474 |
| 2018 | $2,682 | $98,709 | $30,590 | $68,119 |
| 2017 | $3,219 | $98,189 | $28,578 | $69,611 |
| 2016 | $2,511 | $90,101 | $20,125 | $69,976 |
| 2015 | $2,505 | $78,243 | $18,918 | $59,325 |
| 2014 | $2,432 | $71,983 | $10,063 | $61,920 |
Source: Public Records
Map
Nearby Homes
- 2712 Quail Roost Way
- 9544 Lazy River Dr
- 9429 Abalone Way
- 2913 Domino Way
- 2724 Monrovia Dr
- 2728 Monrovia Dr
- 9113 Anchor Cove Ct
- 9100 Shelter Cove Ct
- 2729 Beachside Ct
- 2300 Storkspur Way
- 2200 S Fort Apache Rd Unit 2202
- 2200 S Fort Apache Rd Unit 1077
- 2200 S Fort Apache Rd Unit 2073
- 2200 S Fort Apache Rd Unit 2237
- 2200 S Fort Apache Rd Unit 1038
- 2200 S Fort Apache Rd Unit 1050
- 2200 S Fort Apache Rd Unit 1168
- 2200 S Fort Apache Rd Unit 2017
- 9708 Blazing Star Ct
- 3009 Periscope Ct
- 2701 Shady Pond Way
- 2701 Renwick Cir
- 2708 Shady Pond Way Unit 8B
- 2705 Renwick Cir
- 2705 Shady Pond Way
- 2709 Shady Pond Way
- 2712 Shady Pond Way Unit 8B
- 2709 Renwick Cir
- 2704 Fire Water Ct
- 2713 Shady Pond Way
- 2700 Renwick Cir
- 2716 Shady Pond Way
- 2708 Fire Water Ct
- 2713 Renwick Cir
- 2712 Fire Water Ct
- 2717 Shady Pond Way
- 2704 Renwick Cir
- 2717 Renwick Cir
- 2708 Renwick Cir