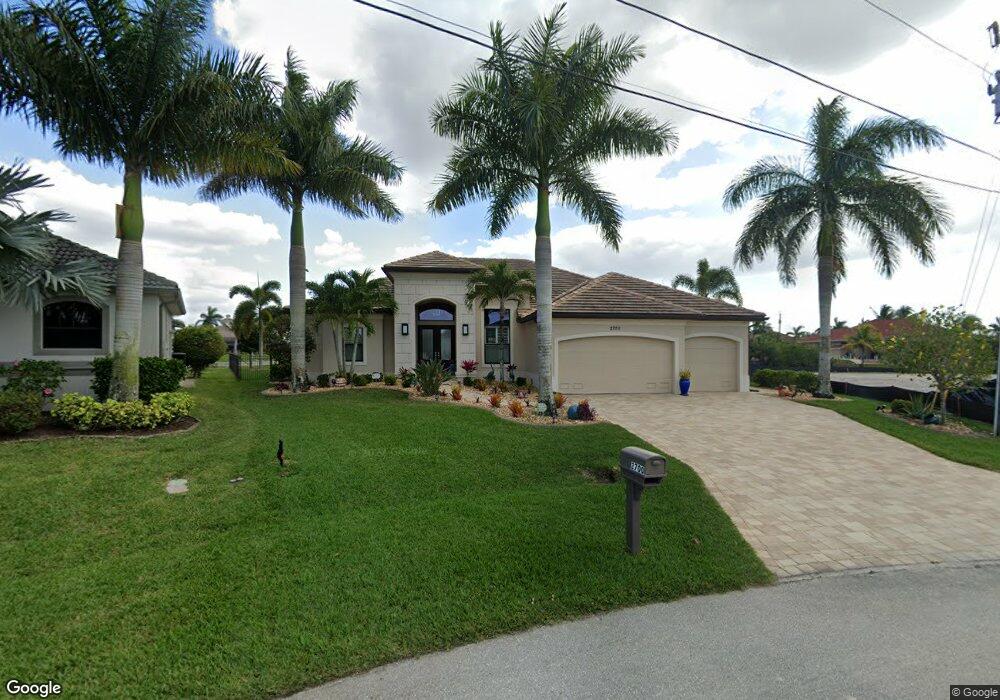
2700 SW 25th St Cape Coral, FL 33914
Pelican NeighborhoodEstimated Value: $836,000 - $1,207,000
3
Beds
3
Baths
3,394
Sq Ft
$291/Sq Ft
Est. Value
About This Home
This home is located at 2700 SW 25th St, Cape Coral, FL 33914 and is currently estimated at $989,240, approximately $291 per square foot. 2700 SW 25th St is a home with nearby schools including Cape Elementary School, Caloosa Elementary School, and Tropic Isles Elementary School.
Ownership History
Date
Name
Owned For
Owner Type
Purchase Details
Closed on
Jan 6, 2012
Sold by
Pelletier Shane and Pelletier Kristen
Bought by
Bales Gary and Bales Jane
Current Estimated Value
Purchase Details
Closed on
Apr 12, 2010
Sold by
Pelletier Normand
Bought by
Pelletier Shane and Pelletier Kristen
Purchase Details
Closed on
Apr 19, 2002
Sold by
Dubek Joseph F and Dubek Shirley K
Bought by
Pelletier Normand
Purchase Details
Closed on
May 25, 2001
Sold by
Missler Peter
Bought by
Dubek Joseph F and Dubek Shirley K
Home Financials for this Owner
Home Financials are based on the most recent Mortgage that was taken out on this home.
Original Mortgage
$53,528
Interest Rate
7.05%
Purchase Details
Closed on
Oct 7, 1997
Sold by
Dikomeit Hackenbuchner Frank and Dikomeit Hackenbuchner Regine
Bought by
Missler Peter
Purchase Details
Closed on
Sep 26, 1997
Sold by
Geta Hackenbuchner Bernd and Geta Hackenbuchner
Bought by
Missler Peter
Create a Home Valuation Report for This Property
The Home Valuation Report is an in-depth analysis detailing your home's value as well as a comparison with similar homes in the area
Home Values in the Area
Average Home Value in this Area
Purchase History
| Date | Buyer | Sale Price | Title Company |
|---|---|---|---|
| Bales Gary | $80,000 | Chairman Title Llc | |
| Pelletier Shane | $70,000 | Rels Title | |
| Pelletier Normand | $159,900 | -- | |
| Dubek Joseph F | $65,000 | -- | |
| Missler Peter | $16,700 | -- | |
| Missler Peter | $16,800 | -- |
Source: Public Records
Mortgage History
| Date | Status | Borrower | Loan Amount |
|---|---|---|---|
| Previous Owner | Dubek Joseph F | $53,528 |
Source: Public Records
Tax History Compared to Growth
Tax History
| Year | Tax Paid | Tax Assessment Tax Assessment Total Assessment is a certain percentage of the fair market value that is determined by local assessors to be the total taxable value of land and additions on the property. | Land | Improvement |
|---|---|---|---|---|
| 2025 | $4,377 | $620,423 | -- | -- |
| 2024 | $6,805 | $602,938 | -- | -- |
| 2023 | $6,805 | $290,188 | $0 | $0 |
| 2022 | $7,257 | $558,306 | $0 | $0 |
| 2021 | $7,437 | $622,195 | $216,407 | $405,788 |
| 2020 | $7,358 | $534,561 | $0 | $0 |
| 2019 | $7,193 | $522,543 | $0 | $0 |
| 2018 | $7,208 | $512,800 | $0 | $0 |
| 2017 | $7,211 | $502,253 | $176,000 | $326,253 |
| 2016 | $7,485 | $514,638 | $181,466 | $333,172 |
| 2015 | $7,975 | $545,919 | $160,944 | $384,975 |
| 2014 | -- | $144,406 | $144,406 | $0 |
| 2013 | -- | $122,206 | $122,206 | $0 |
Source: Public Records
Map
Nearby Homes
- 2712 SW 25th St
- 2709 SW 25th St
- 2531 SW 27th Ave
- 2525 SW 27th Place
- 2602 SW 25th St Unit 29
- 2532 SW 26th Place
- 2648 Somerville Loop Unit 1306
- 2733 SW 25th St
- 2527 SW 25th Terrace
- 2620 Somerville Loop Unit 2004
- 2548 SW 26th Place
- 2520 SW 25th St
- 2664 Somerville Loop Unit 901
- 2810 SW 25th St
- 2563 SW 27th Ave
- 2615 Somerville Loop Unit 307
- 2510 Miracle Pkwy
- 2611 Somerville Loop Unit 201
- 2502 Miracle Pkwy
- 2580 SW 26th Terrace
- 2704 SW 25th St
- 2413 SW 27th Ave
- 2708 SW 25th St
- 2409 SW 27th Ave
- 2701 SW 25th St
- 2705 SW 25th St
- 2712 SW 25th St Unit 20
- 2519 SW 27th Ave
- 2405 SW 27th Ave
- 2701 SW 25th Terrace
- 2707 SW 25th Terrace
- 2400 SW 27th Ave
- 2408 SW 26th Place
- 2612 SW 25th St
- 2711 SW 25th Terrace
- 2711 SW 25th Terrace Unit 47
- 2401 SW 27th Ave
- 2708 Miracle Pkwy Unit 93
- 2521 SW 27th Ave
- 2713 SW 25th St