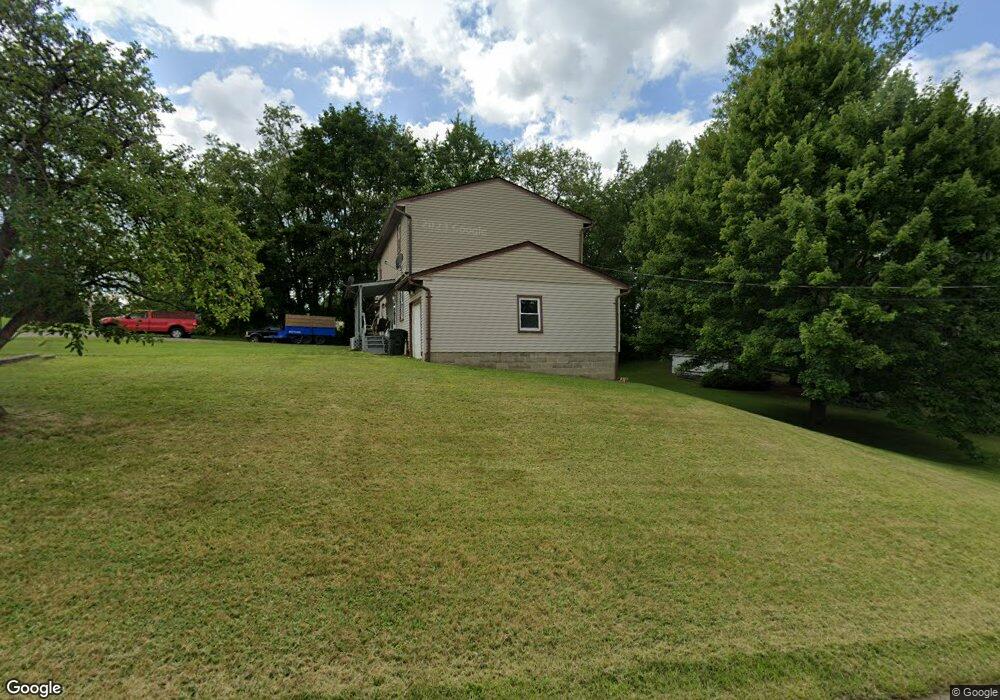
2701 20th St SW Canton, OH 44706
Estimated Value: $156,000 - $213,000
4
Beds
2
Baths
2,016
Sq Ft
$95/Sq Ft
Est. Value
About This Home
This home is located at 2701 20th St SW, Canton, OH 44706 and is currently estimated at $192,333, approximately $95 per square foot. 2701 20th St SW is a home located in Stark County with nearby schools including Early Learning Center @ Schreiber, Cedar Elementary School, and McGregor Elementary School.
Ownership History
Date
Name
Owned For
Owner Type
Purchase Details
Closed on
Jun 6, 2025
Sold by
Mulholland Holdings Llc
Bought by
Jet Properties Of Ohio Llc
Current Estimated Value
Home Financials for this Owner
Home Financials are based on the most recent Mortgage that was taken out on this home.
Original Mortgage
$511,840
Outstanding Balance
$490,164
Interest Rate
6.81%
Mortgage Type
Credit Line Revolving
Estimated Equity
-$297,831
Purchase Details
Closed on
Aug 23, 2017
Sold by
Premier Homes Inc
Bought by
Mulholland Holdings Llc
Home Financials for this Owner
Home Financials are based on the most recent Mortgage that was taken out on this home.
Original Mortgage
$74,925
Interest Rate
4.03%
Mortgage Type
Future Advance Clause Open End Mortgage
Purchase Details
Closed on
Nov 21, 2003
Sold by
Moser Robert D and Moser Susan M
Bought by
Evans Thomas H and Evans Darla L
Create a Home Valuation Report for This Property
The Home Valuation Report is an in-depth analysis detailing your home's value as well as a comparison with similar homes in the area
Purchase History
| Date | Buyer | Sale Price | Title Company |
|---|---|---|---|
| Jet Properties Of Ohio Llc | $189,900 | None Listed On Document | |
| Mulholland Holdings Llc | $99,900 | None Available | |
| Evans Thomas H | $50,000 | -- |
Source: Public Records
Mortgage History
| Date | Status | Borrower | Loan Amount |
|---|---|---|---|
| Open | Jet Properties Of Ohio Llc | $511,840 | |
| Previous Owner | Mulholland Holdings Llc | $74,925 |
Source: Public Records
Tax History
| Year | Tax Paid | Tax Assessment Tax Assessment Total Assessment is a certain percentage of the fair market value that is determined by local assessors to be the total taxable value of land and additions on the property. | Land | Improvement |
|---|---|---|---|---|
| 2025 | -- | $35,110 | $4,660 | $30,450 |
| 2024 | -- | $35,110 | $4,660 | $30,450 |
| 2023 | $1,439 | $23,600 | $3,330 | $20,270 |
| 2022 | $1,402 | $23,600 | $3,330 | $20,270 |
| 2021 | $1,416 | $23,600 | $3,330 | $20,270 |
| 2020 | $1,360 | $20,300 | $2,870 | $17,430 |
| 2019 | $1,186 | $20,300 | $2,870 | $17,430 |
Source: Public Records
Map
Nearby Homes
- 1653 Bedford Ave SW
- 1624 Tanner Ave SW
- 1640 Bedford Ave SW
- 1553 Tanner Ave SW
- 0 20th St SW
- 1425 Crescent Rd SW
- 0 Harrison Ave SW
- 3204 14th St SW
- 1729 Gambrinus Ave SW
- 1252 Dartmouth Ave SW
- 1248 Dartmouth Ave SW
- 1700 Clark Ave SW
- 1721 Hammond Ave SW
- 1241 Bedford Ave SW
- 1225 Concord Ave SW
- 4014 21st St SW
- 1212 Maryland Ave SW
- 2519 12th St SW
- 2423 12th St SW
- 2103 Henry Ave SW
- 1917 Frederick Ave SW
- 1922 Tanner Ave SW
- 1908 Tanner Ave SW
- 2015 Frederick Ave SW
- 1903 Frederick Ave SW
- 2617 20th St SW
- 1918 Frederick Ave SW
- 2720 20th St SW
- 1901 Frederick Ave SW
- 1900 Tanner Ave SW
- 2807 20th St SW
- 1911 Tanner Ave SW
- 0 Frederick Ave SW
- 2609 20th St SW
- 2022 Tanner Ave SW
- 1917 Clarendon Ave SW
- 1905 Tanner Ave SW
- 2023 Frederick Ave SW
- 2601 20th St SW
- 2808 20th St SW
Your Personal Tour Guide
Ask me questions while you tour the home.