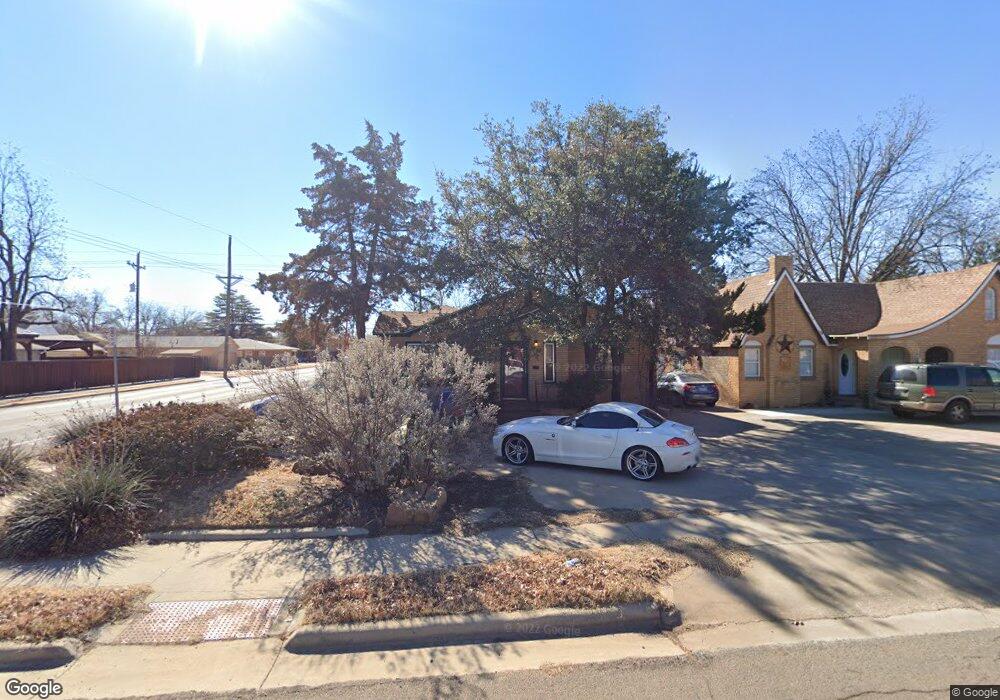
2701 21st St Unit Rear Lubbock, TX 79410
Tech Terrace (UNIT) NeighborhoodEstimated Value: $283,000 - $314,000
1
Bed
1
Bath
480
Sq Ft
$609/Sq Ft
Est. Value
About This Home
This home is located at 2701 21st St Unit Rear, Lubbock, TX 79410 and is currently estimated at $292,526, approximately $609 per square foot. 2701 21st St Unit Rear is a home located in Lubbock County with nearby schools including Wilson Elementary School, Hutchinson Middle School, and Lubbock High School.
Ownership History
Date
Name
Owned For
Owner Type
Purchase Details
Closed on
Apr 9, 2005
Sold by
Mullins Caroline S
Bought by
Mullins Joseph E and Mullins John H
Current Estimated Value
Purchase Details
Closed on
Dec 29, 2003
Sold by
Mullins Caroline S
Bought by
Mullins Joseph E and Mullins John H
Purchase Details
Closed on
Mar 23, 1995
Sold by
Stokes Luella
Bought by
Mullins Joseph E and Mullins John H
Create a Home Valuation Report for This Property
The Home Valuation Report is an in-depth analysis detailing your home's value as well as a comparison with similar homes in the area
Home Values in the Area
Average Home Value in this Area
Purchase History
| Date | Buyer | Sale Price | Title Company |
|---|---|---|---|
| Mullins Joseph E | -- | -- | |
| Mullins Joseph E | -- | -- | |
| Mullins Joseph E | -- | -- |
Source: Public Records
Tax History
| Year | Tax Paid | Tax Assessment Tax Assessment Total Assessment is a certain percentage of the fair market value that is determined by local assessors to be the total taxable value of land and additions on the property. | Land | Improvement |
|---|---|---|---|---|
| 2025 | $4,111 | $279,361 | $45,350 | $234,011 |
| 2024 | $44 | $273,869 | $45,350 | $228,519 |
| 2023 | $4,104 | $220,792 | $24,000 | $196,792 |
| 2022 | $4,063 | $200,720 | $24,000 | $203,456 |
| 2021 | $3,908 | $182,473 | $24,000 | $158,473 |
| 2020 | $4,117 | $189,318 | $24,000 | $165,318 |
| 2019 | $4,250 | $189,318 | $24,000 | $165,318 |
| 2018 | $4,256 | $189,318 | $24,000 | $165,318 |
| 2017 | $4,096 | $182,000 | $24,000 | $158,000 |
| 2016 | $4,096 | $182,000 | $24,000 | $158,000 |
| 2015 | $4,718 | $200,642 | $24,000 | $176,642 |
| 2014 | $4,718 | $212,181 | $10,000 | $202,181 |
Source: Public Records
Map
Nearby Homes
Your Personal Tour Guide
Ask me questions while you tour the home.